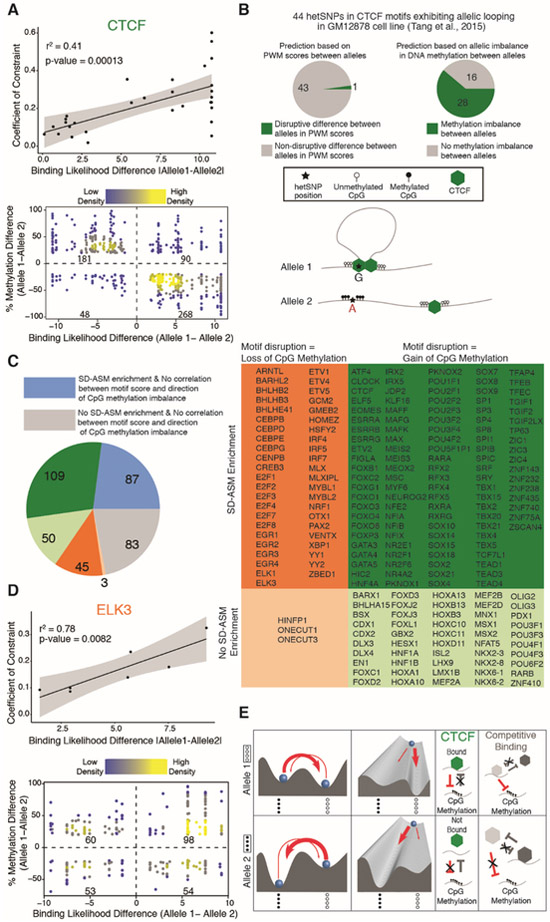
Fig. 3. Correlations between allelic differences in TF binding affinity, Coefficient of Constraint, and DNA methylation.
(A) (Top) Correlation between absolute CTCF binding affinity differences, based on position weight matrix scores (PWM), and the Coefficient of Constraint for predicted CTCF binding sites with SD-ASM, two frequent epialleles, and a biphasic methylation pattern. (Bottom) Correlation between CTCF binding affinity and DNA methylation at predicted CTCF binding sites. (B) SD-ASM is more predictive of allelic looping (28 true positive of 44 predictions) than motif disruption scores (1 true positive of 44 predictions). To control for specificity, thresholds were selected so that both methods predicted the same number (44) of hets to show allelic looping. (C) SD-ASM at binding sites of 377 TFs defined with the SELEX method. The pie chart on the left and the table on the right indicate both enrichments and directionality trends using a shared color code. (D) Top: Correlation between absolute ELK3 binding affinity differences and the Coefficient of Constraint for predicted binding sites with SD-ASM, two frequent epialleles, and a biphasic methylation pattern; Bottom: Correlation between ELK3 binding affinity and DNA methylation at predicted ELK3 binding sites (E) A mechanistic model of a sequence-dependent energy landscape with two metastable states, Allele 1 (top row) corresponding to a landscape where the most frequently occupied metastable state corresponds to a completely unmethylated epiallele and Allele 2 (bottom row) corresponding to a landscape where the most frequently occupied metastable state corresponds to a completely methylated epiallele. Putative positive feedback loops involving interactions between TF binding and binding site methylation are indicated for CTCF. An alternative model involving competitive binding of two transcription factors is indicated on the right. Significance of correlations tested using t test.

