
Fig. 4.
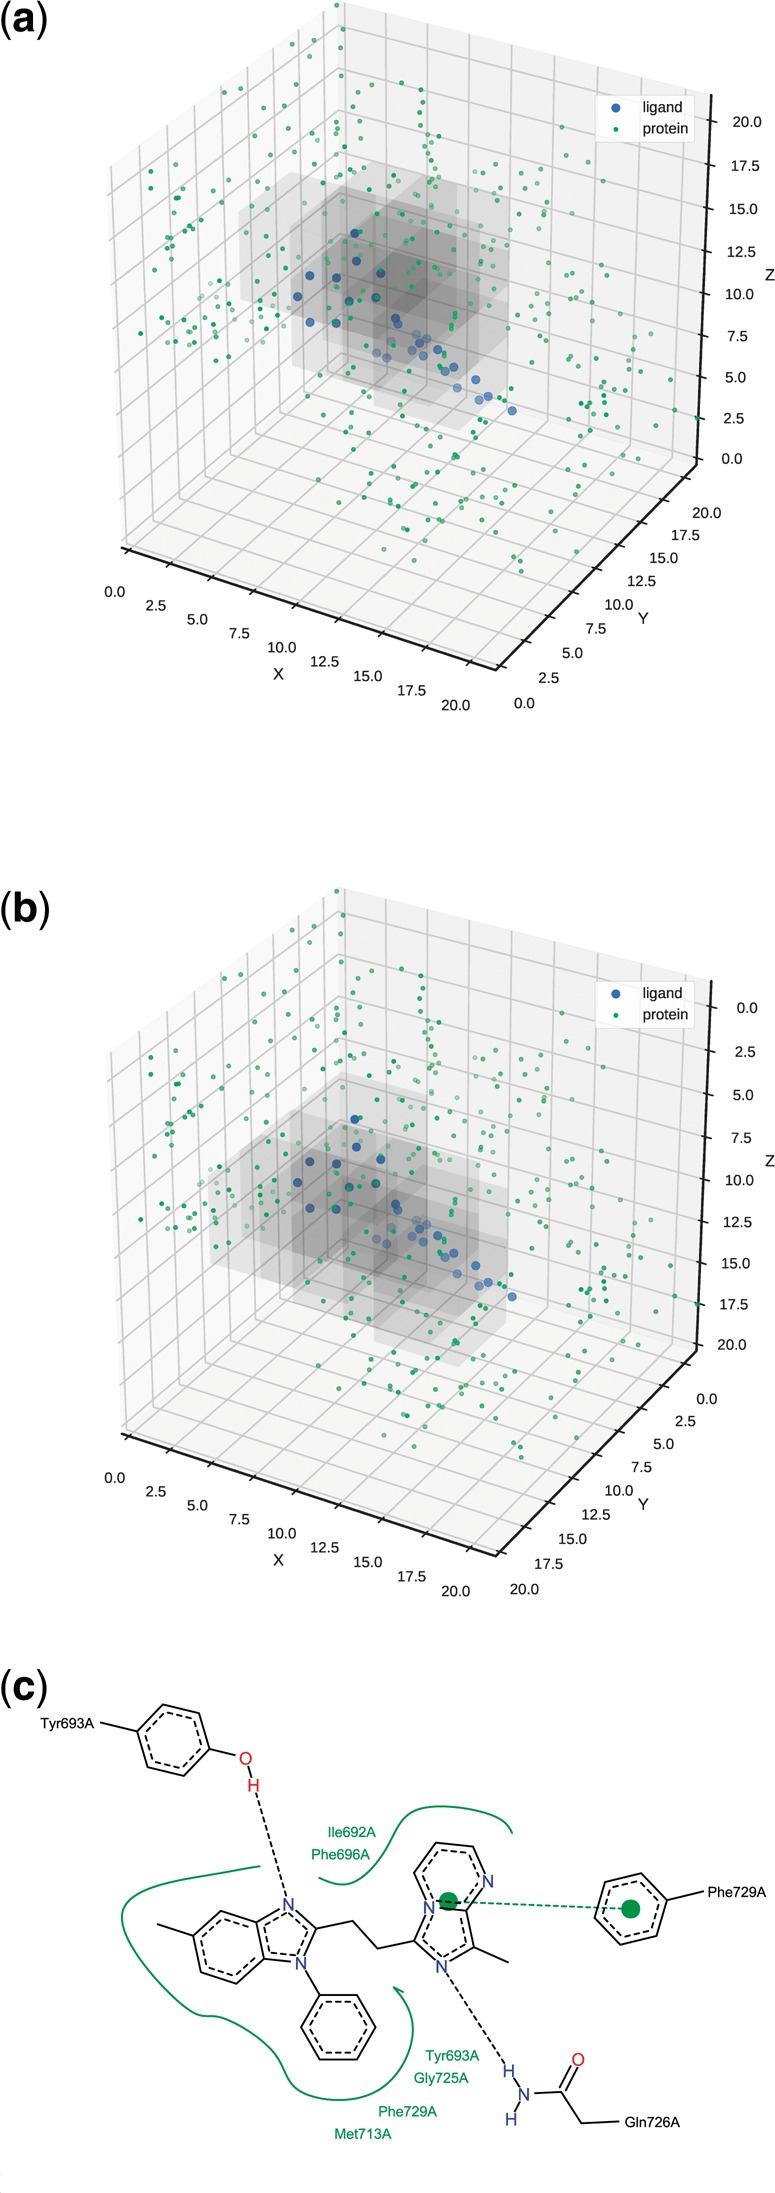
The most important parts of the input. Regardless of the complex orientation, the same region of the input had the highest impact on the prediction. Note that the second plot is rotated back about the X-axis to ease the comparison. (a) Original orientation. (b) Rotated by about the X-axis. (c) Protein–ligand interactions. Graphic was generated with Poseview (Stierand and Rarey, 2010)