
Fig. 5.
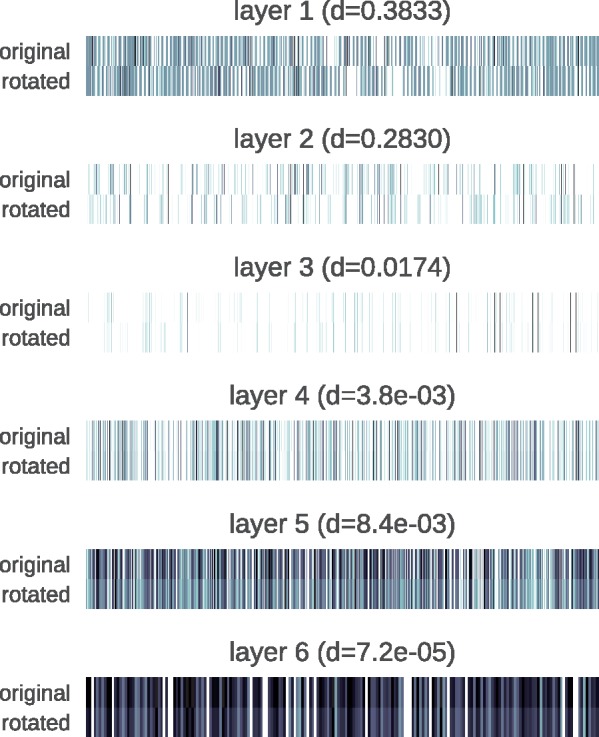
Activations on the hidden layers for two orientations of the PDE10A complex (PDB ID: 3WS8). Darker colors indicate higher values. Cosine distances (d) between the activation patterns for each layer are provided
Official websites use .gov
A
.gov website belongs to an official
government organization in the United States.
Secure .gov websites use HTTPS
A lock (
) or https:// means you've safely
connected to the .gov website. Share sensitive
information only on official, secure websites.
Activations on the hidden layers for two orientations of the PDE10A complex (PDB ID: 3WS8). Darker colors indicate higher values. Cosine distances (d) between the activation patterns for each layer are provided