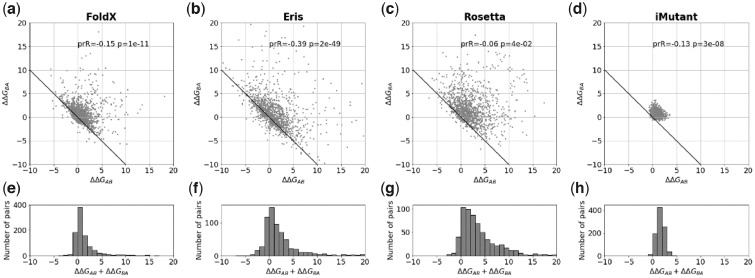
Fig. 2.
The bias for single substitutions for FoldX, Eris, Rosetta and I-Mutant. (a–d) The relationship between predicted changes of stability ΔΔGAB and ΔΔGBA for the forward and reverse mutations, where the structures A and B differ by a single substitution. The ‘ideal’ relationship ΔΔGAB+ΔΔGBA=0 is shown as a solid line. Because of symmetry of the protocol, every pair of structures A and B is plotted as (A; B) and (B; A), so the plot is symmetric relative to the y=x line. ‘prR’ and ‘p’ are the Pearson correlation coefficient and the associated P-value. (e–h) The histograms of the sum of two changes of stability ΔΔGAB+ΔΔGBA for the forward and reverse mutations for FoldX, Eris, Rosetta and I-Mutant, respectively

