
Fig. 3.
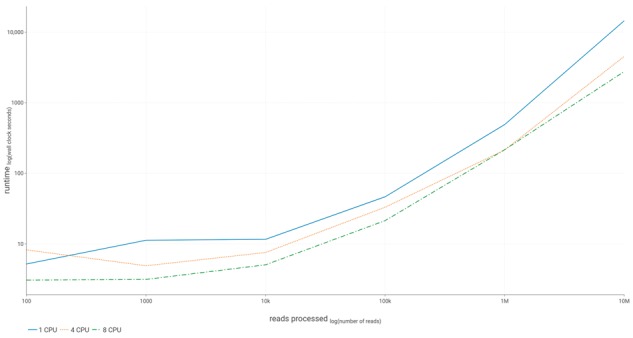
Runtime performance. This figure shows the runtime performance of our implementation (GROOT) on 1, 4, and 8 CPUs. The data were collected during the accuracy assessment of GROOT, where it classified ARG-derived reads (no false negatives were recorded)