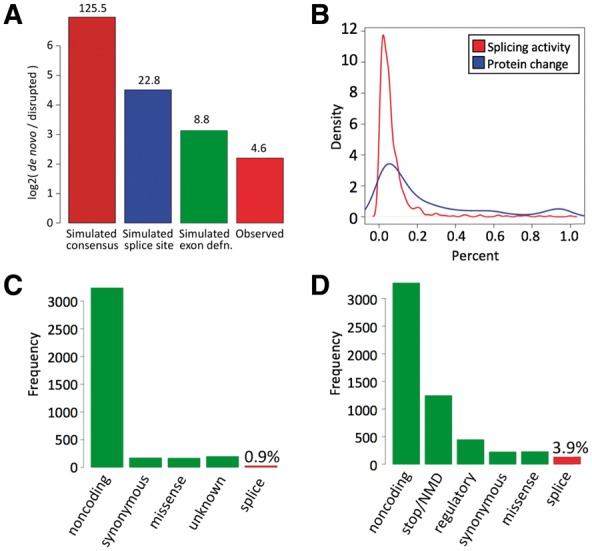
Fig. 3.

(A) Log2 (number of de novo splice sites/number of disrupted splice sites) in mutation simulations (brown: requiring only a 2 bp consensus for de novo splice sites; blue: requiring sufficiently high score under splice-site model for de novo splice sites; green: requiring sufficiently high score under the splice-site model and favorable exon definition context for de novo splice sites), and in predictions supported by RNA-seq (red). Numbers above bars are raw (non-log2) ratios. (B) Estimates of relative splicing activity (red) and protein change (blue) due to de novo splice sites supported by RNA-seq. (C) Frequencies of dbSNP classifications of variants predicted to create de novo splice sites and supported by spliced RNA-seq reads. (D) Frequencies of VEP classifications of variants creating de novo splice sites supported by RNA-seq
