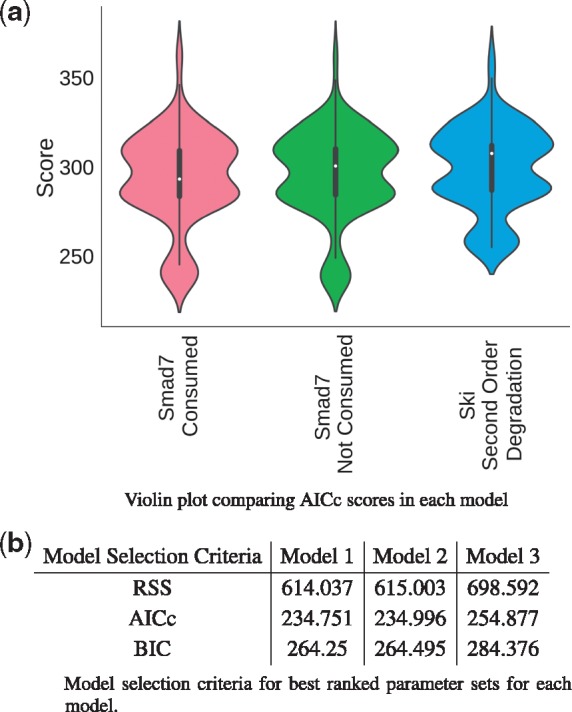
Fig. 3.

Model selection criteria. (a) Distribution of Akaike information criteria (AICc) per model displayed as violin plot. The central white dot represents the median; the thin centre line is the 95% confidence interval; the thick central bar is the interquartile range and the width represents the frequency with which a score was observed. These graphs were produced with ‘viz.ModelSelection’. (b) A comparison of model selection criteria for the best ranking parameter sets in each model
