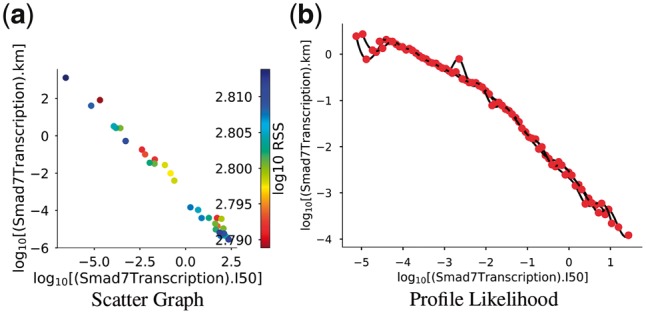
Fig. 7.

Identification of a log-linear relationship between ‘(Smad7Transcription).km’ and ‘(Smad7Transcription).I50’ (km and I50, respectively). (a) Scatter graph showing that as km increases, I50 decreases (r2 = 0.995, P-value = 1). (b) The path traced by km is plotted as a function of I50 during the profile likelihood calculation. Graphs were produced using ‘viz.Scatters’ and ‘viz.PlotProfileLikelihood’ respectively
