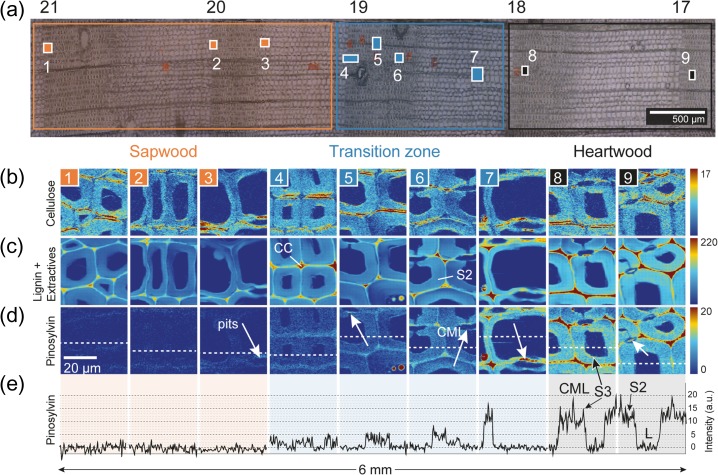
Figure 2.
In-situ Raman mapping of pine tracheids during heartwood formation. (a) Bright field image of a transverse microsection of a fresh pine stem from sapwood to heartwood (17–21st annual ring counted from pith to bark). Raman measurement areas are marked by the numbered rectangles (1–9). (b–d) Raman images (40 × 40 μm) based on bands for (b) cellulose (1076–1110 cm−1), (c) phenolic compounds (1556–1694 cm–1) and (d) pinosylvins (982–1011 cm–1, 1,3,5-substituted aromatic ring). (e) The graph is plotted as an intensity (997 cm–1) profile along the white dotted lines at d. Legend: CC, cell corner; CML, compound middle lamella; S2 and S3, secondary cell walls; L, Lumen.

