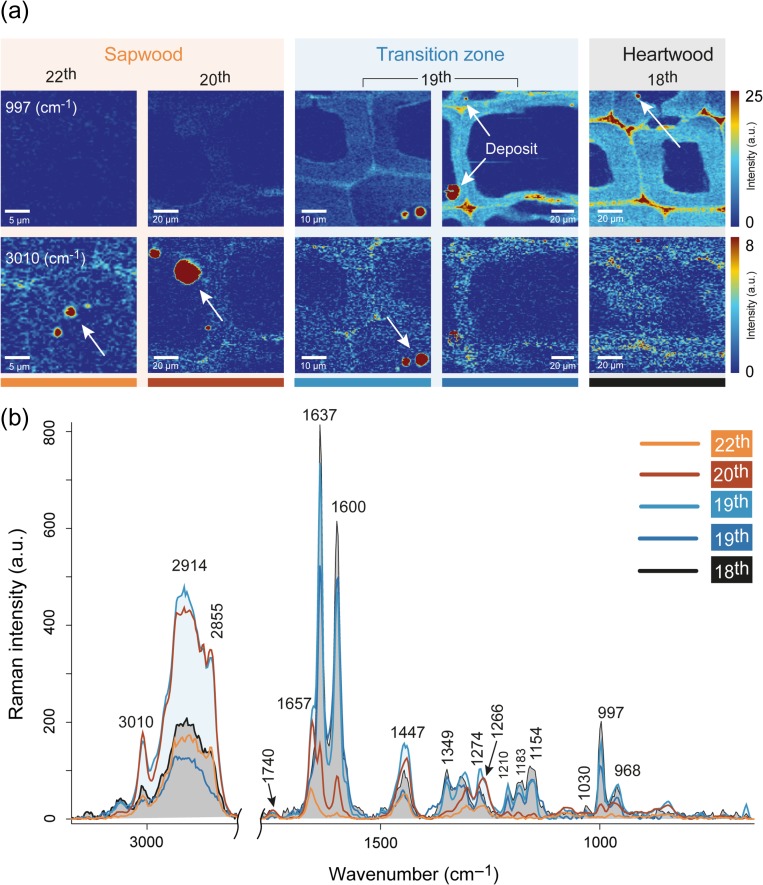
Figure 4.
Learning from similarities and differences of various deposits. (a) Raman images including deposits in the lumen of sapwood (annual ring 22nd and 20th), transition zone (annual ring 19th) and heartwood (annual ring 18th). The first row is based on integrating the pinosylvins marker band at 997 cm–1, while the second row is based on the lipid band at 3010 cm−1 (2998–3025 cm−1). (b) Average spectra of the deposits showing the changing chemical composition of the deposits.

