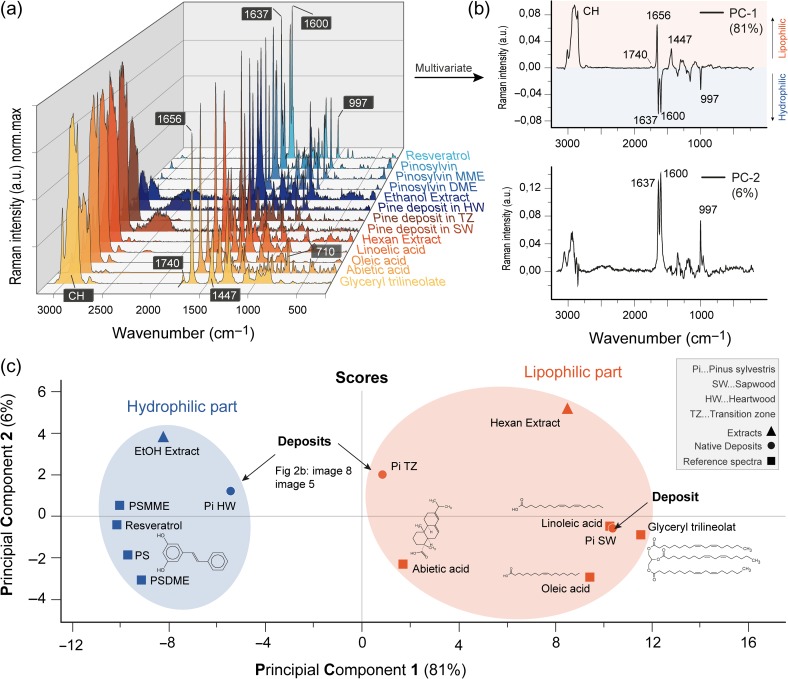
Figure 5.
Lipophilic or hydrophilic? Multivariate comparison of spectra from pine references, extractives and native deposits. (a) Raman spectra of extractives reference compounds grouped in lipophilic (orange) and hydrophilic (blue) components compared with deposits in sapwood (SW, position 22nd), transition tone (TZ, image 5) and heartwood (HW, image 8) of native pinewood (Figure 2) as well as the Hexan and EtOH extract. The spectra are baseline corrected using concave rubberband (polynomial 6) and min–max normalized in a frequency range from 200 to 3170 cm−1. (b) Loadings (PC-1 and PC-2) of the PCA. Note that these are an abstract representation of the spectral profiles with negative values. PC-1 distinguishes clearly the lipophilic part (CH-stretch, 1656 and 1447 cm−1) with the positive values whereas the negative values represent the hydrophilic part with the stilbene marker bands 1637, 1600 and 997 cm−1. PC-2 shows mostly the hydrophilic part. (c) PCA scores (PC-1 vs PC-2; 87% of model explicability) separate all the spectra into a hydrophilic (blue) and lipophilic (red) group.

