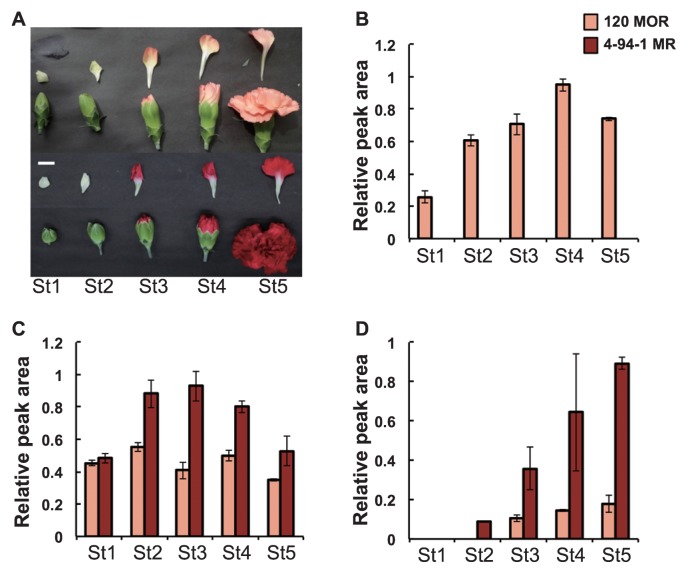
Fig. 2.
The phenotypes of the carnation cultivars used in this experiment. (A) Flower developmental stages in ‘120 MOR’ and ‘4-94-1 MR’. White bar indicates 1 cm. (B) Relative accumulation of Ch2′G. In petals of ‘4-94-1 MR’ at all stages, Ch2′G was below detectable levels in the HPLC analysis. (C) Relative accumulation of flavonols (total of kaempferol 3-neohesperioside, kaempferol 3-sophoroside and kaempferol 3-glucosyl-(1→2)-[rhamnosyl-(1→6)-glucoside]). (D) Relative accumulation of anthocyanin (total of pelargonidin 3-glucoside and pelargonidin 3-malylglucoside). Error bars indicate ± SD for three biological replicates.

