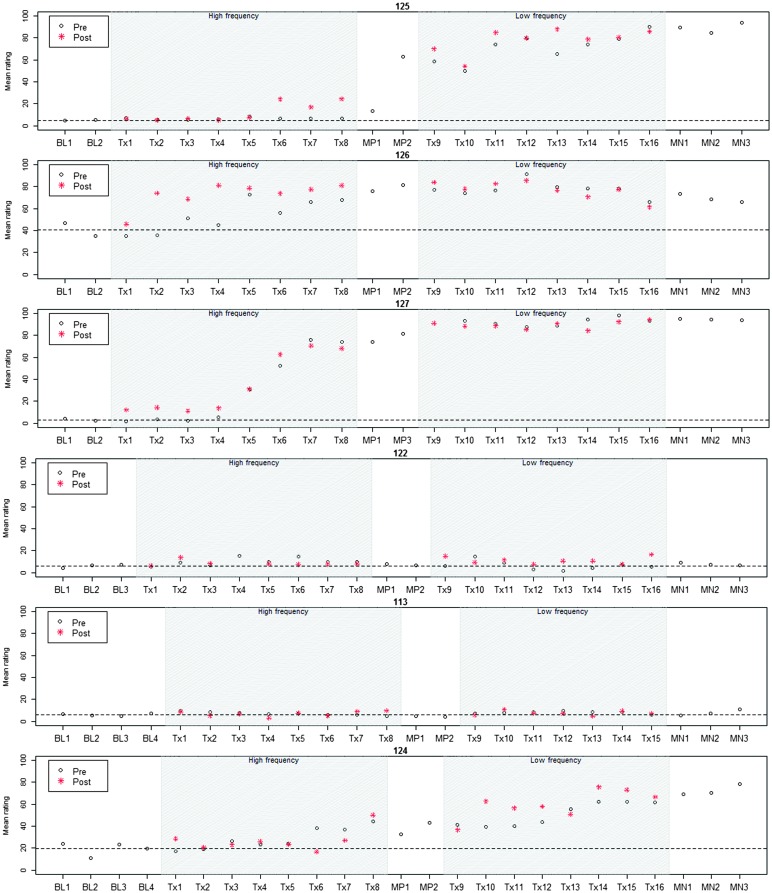
Figure 1.
Individual plots for six participants who received high-frequency ultrasound treatment followed by low-frequency ultrasound treatment. y-Axis represents the proportion of probe words rated as correct. x-Axis represents time (BL = baseline; Tx = treatment session; MP = midpoint; MN = maintenance). During days on which treatment occurred, probes were administered before the session (circles) and after the session (asterisks). Dashed line represents the participant's mean baseline accuracy.

