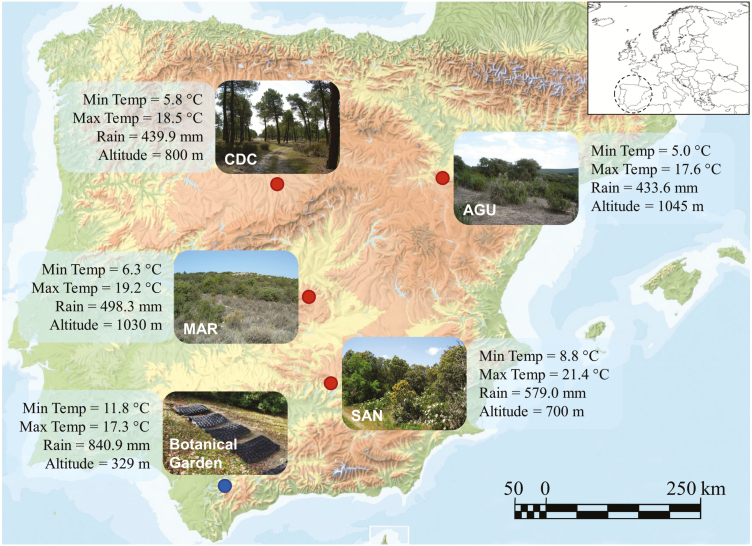
Figure 1.
Map of Spain with the four Arabidopsis thaliana populations of study (red dots). A photograph of each population along with environmental characteristics of populations, such as average annual minimum temperature, average annual maximum temperature, total annual precipitation and altitude, are given. The location of the El Castillejo Botanical Garden where field experiments were conducted is also indicated (blue dot) along with a photograph of experimental blocks and the environmental characteristics of the experimental facility.

