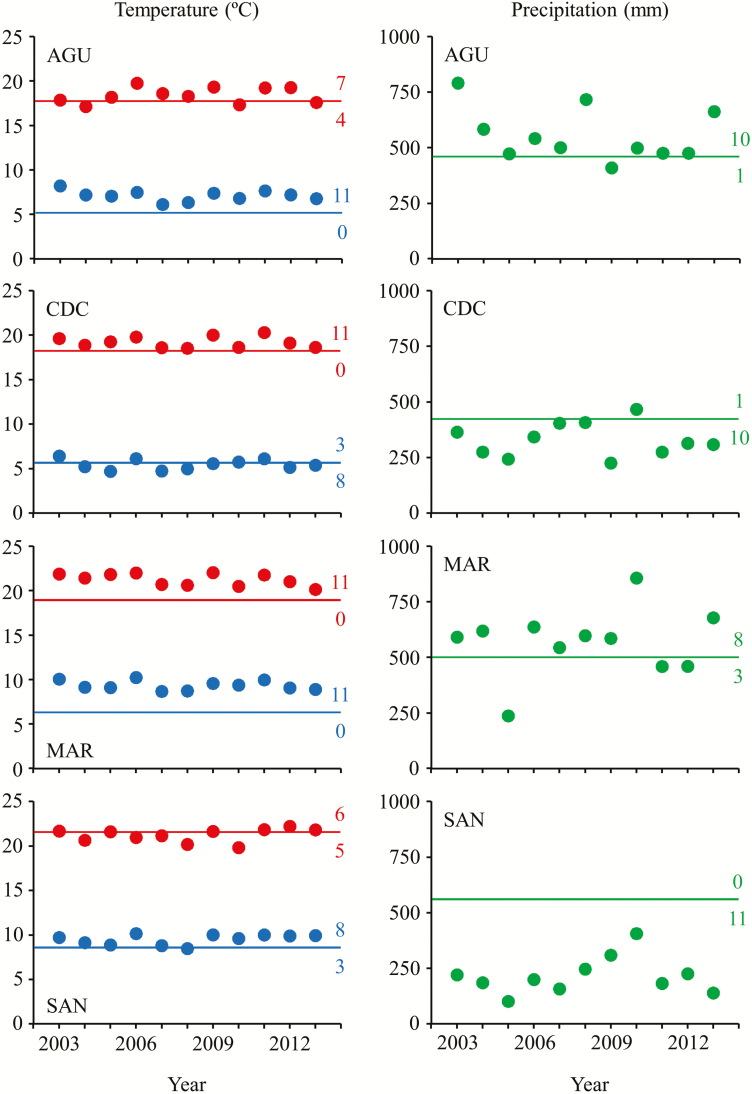
Figure 2.
Average annual minimum temperatures (blue dots), average annual maximum temperatures (red dots) and annual total precipitation (green dots) for each Arabidopsis thaliana population for the period 2003–13. For each weather record, lines indicate the historical value corresponding to the period 1950–99, extracted from the Digital Climatic Atlas from the Iberian Peninsula. For the sake of clarity, the number of years above and below the historical records is also given.

