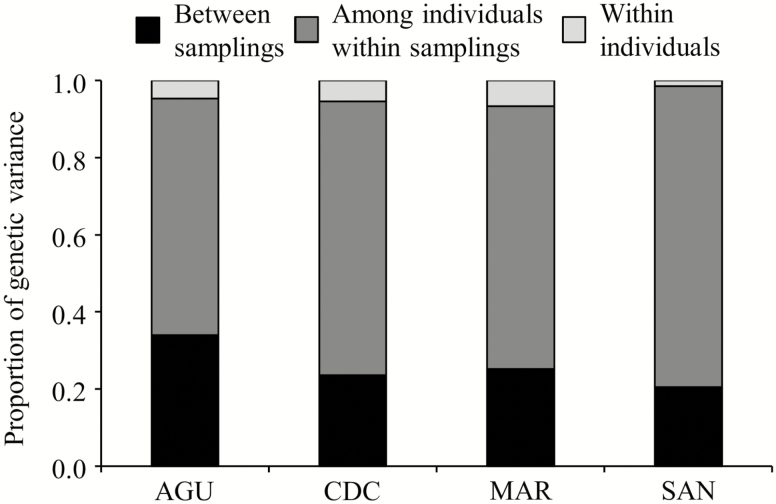
Figure 4.
Proportion of genetic variance obtained from AMOVA for each Arabidopsis thaliana population. Genetic variance is partitioned between samplings, among individuals within samplings and within individuals. Mean values from 100 analyses using subsamples of equal size are given. Standard deviations are not shown because they were very low.

