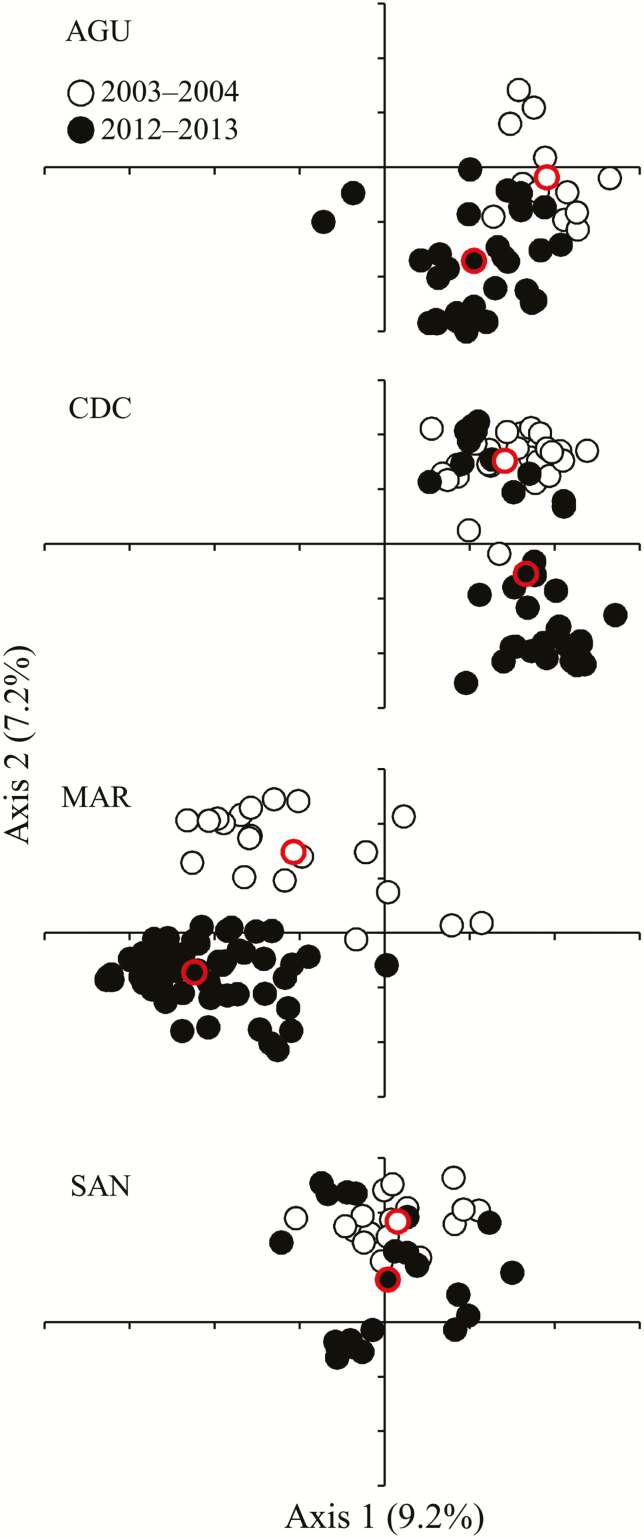
Figure 5.
Scatter plots displaying the first two eigenvectors estimated by PCoA of Arabidopsis thaliana non-redundant multilocus genotypes using 12 nuclear microsatellites. For the sake of clarity, populations are shown in different panels, although eigenvectors come from a unique analysis combining all data from all populations and samplings. Multilocus genotypes from the first sampling (2003–04; hollow dots) and multilocus genotypes from the second sampling (2012–13; filled dots) are indicated for each population. The centroids (dots with red contour) for multilocus genotypes from the two samplings and populations are also indicated.

