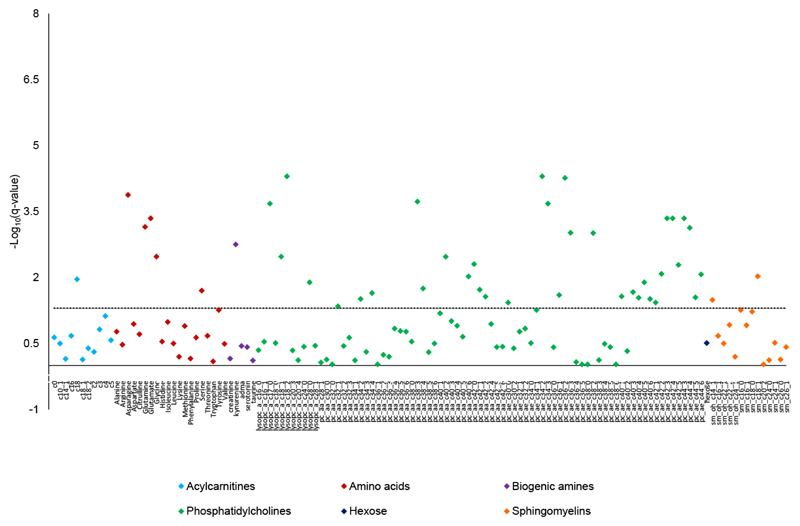
Figure 2.
Associations between body mass index (continuous) and metabolite concentrations plotted as –log10 (q-values) in the EPIC-Hepatobiliary controls cohort. The dashed line shows the corrected significance level (False Discovery Rate). The q-values were derived from linear regression adjusted for sex (female; male), age (years, continuous), the Cambridge index of physical activity (inactive; moderately inactive, moderately active; active), alcohol intake (<1; 1-7; 8-15; ≥16 g/d), smoking status (never; former; current; missing), meat intake (quartiles in g/d: <68.5; 68.5-99.6; 99.6-144.3; ≥144.3); fish intake (quartiles in g/d: <16.1; 16.1-28.3; 28.3-46.3; ≥46.3); batch (categorical), time since last food or drink at blood collection (<3; 3 to 6; ≥6 hours; missing), and country (United Kingdom; Denmark; Greece; Germany; Spain; The Netherlands; Sweden; Italy). The beta coefficient and 95% confidence intervals of metabolite concentrations are shown in Table S2.

