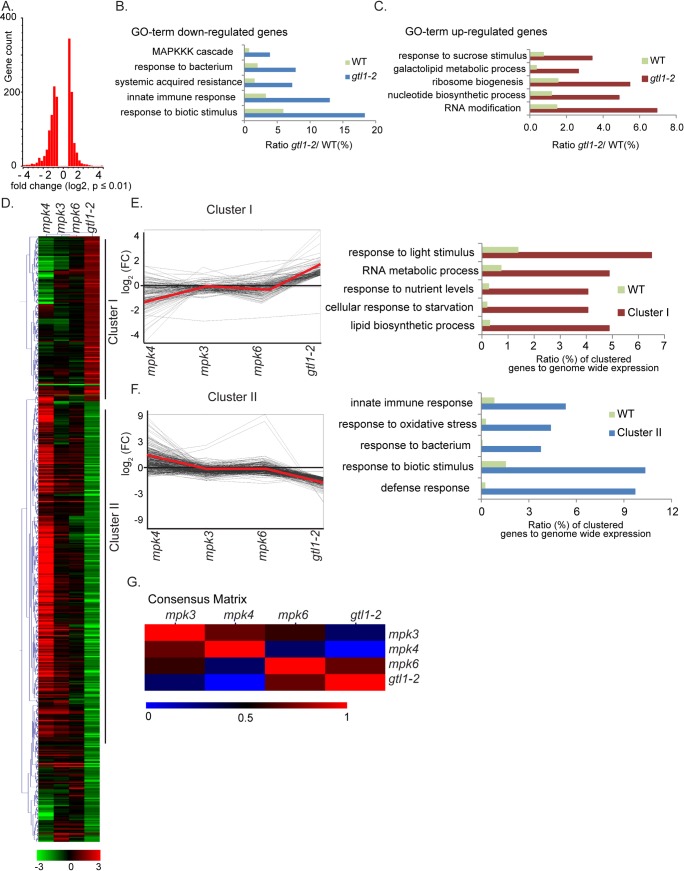
Fig 3. Comparative transcriptome analysis of gtl1 and three immune MAPK mutants mpk3, -4 and -6.
A) Histogram of the Log2 distribution of up- and down-regulated genes in gtl1-2 (S1 Table). B-C) Deregulated genes can be categorized in distinct Gene Ontology terms gtl1-2 (S1 Table).D) Hierarchical clustering of gtl1-2, mpk3, mpk4 and mpk6 transcriptome highlights two main clusters showing opposite deregulated gene expression in gtl1-2 and mpk4. log2 fold (p≤0.01, gtl1-2) of individual genes was used for clustering by using the average linkage method and Pearson Correlation (MeV4.0) (S2 Table).E) Centroid graph (red) and individual expression graphs dedicated to Cluster I. GO term analyses of genes grouped in Cluster I.F) Centroid graph (red) and individual expression graphs dedicated to Cluster II. GO term analyses of genes grouped in Cluster II.G) Consensus matric (Non-Negative Matrix Factorization, Cluster samples) shows most divergent gene expression between the total set of deregulated genes in gtl1-2 and mpk4.

