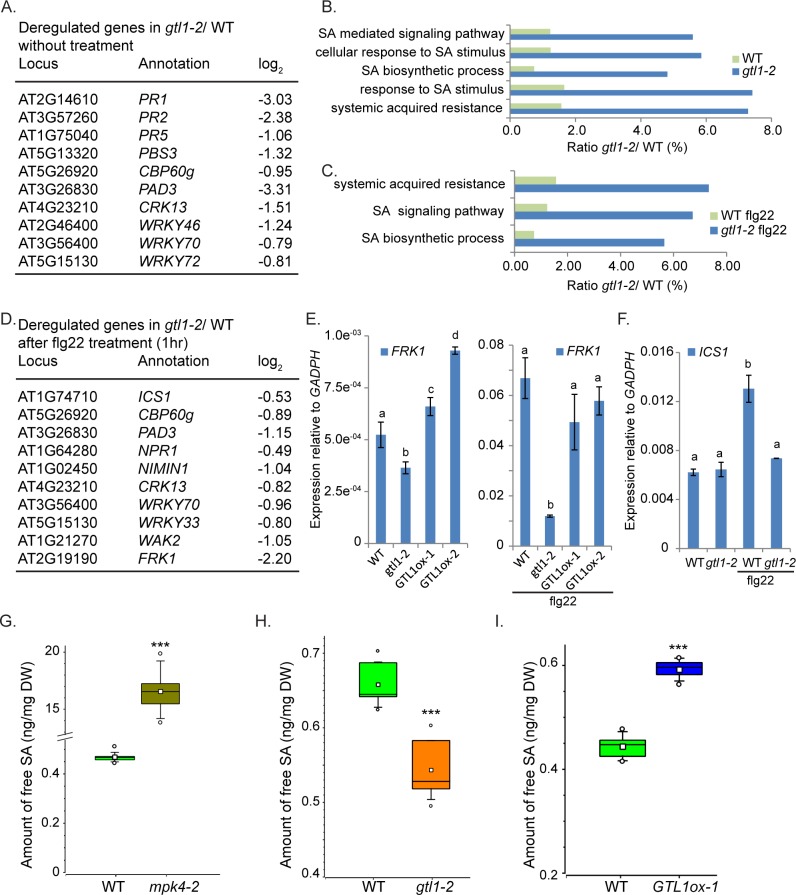
Fig 4. The expression of SA-metabolism/ signaling genes and the levels of salicylic acid are compromised in gtl1-2 mutant.
A, D) Depiction of down-regulated genes (A) in gtl1-2 contributing to SA-biosynthesis and signaling without treatment (S1 Table) and (D) after flg22 treatment (S3 Table) compared to the respective expression in WT. B, C) Significantly down-regulated genes (p≤0.01, 769 genes) in gtl1-2 before and after flg22 treatment (p≤0.0001, 715 genes) can be grouped in GO terms describing gene functions for SA-signaling and metabolism (S2 and S3 Tables).E-F) Expression of SA/PTI-response gene FRK1 (E, S3D Fig) is reduced in gtl1-2 before and after flg22 treatment but shows elevated expression in the GTL1 overexpression lines in untreated conditions. The expression of the SA-biosynthesis gene ICS1 (F) is diminished in gtl1-2 after flg22 treatment. Statistical significance was analyzed by Student’s test Error bars, mean ± SEM, letters above bars represent significance groups, p≤ 0.01.G-I) Quantitative analysis of free salicylic acid by using LC-MS/MS. Box plots are depicted for (G) mpk4-2, (H) gtl1-2 and (I) GTL1ox1 compared to WT. Boxes showing the interquartile range (IQR) 25st to 75th percentiles, inner square representing the median, whiskers show the SEM, outliers are depicted by dots (Min/Max range). Statistical significance was analyzed by Student’s test. Asterisks indicate significant differences compared to WT,*** p≤ 0.001.

