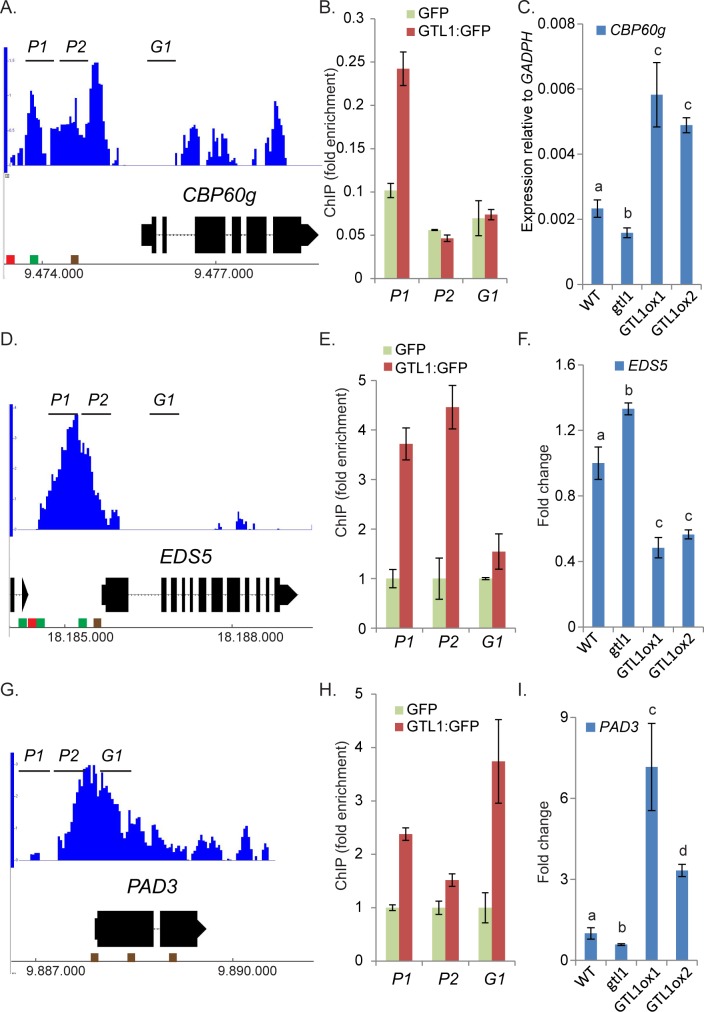
Fig 5. The SA-biosynthesis activator CBP60g, the SA-transporter EDS5 and the SA-responsive gene PAD3 are bound and regulated by GTL1.
A, D, G) Microarray data, provided by Breuer et. al 2012 [45] show significant enrichment of GTL1 binding in the 5’-region of CBP60g (A), EDS5 (D) and PAD3 (G). Brown cube refer to the GT1-box, green cube indicates GT2-box and red cube shows GT3-box. B, E, F) ChIP-qPCR by using three biological replicates of pUBI10::GTL1:GFP expressing plants. GTL1 binding to genomic regions close to CBP60g (B), EDS5 (E) and PAD3 (H) were tested with sets of three primer pairs (P1, P2, G1) for each locus. Y-axis shows the fold enrichment in the pUBI10::GTL1:GFP lines normalized to GFP immunoprecipitation, driven by the pUBI10 promoter (0.64 kb). C, F, I) The expression of CBP60g (C) and PAD3 (I) is diminished in gtl1-2 and elevated in GTL1ox1 and GTL1ox2. The expression of EDS5 is elevated in gtl1-2 and reduced in GTL1ox1 and GTL1ox2. Asterisks indicate significant differences compared to WT, * p≤ 0.05. ** p≤ 0.01. Statistical significance was analyzed by Student’s test. Letters above bars represent significance groups, p≤ 0.05.

