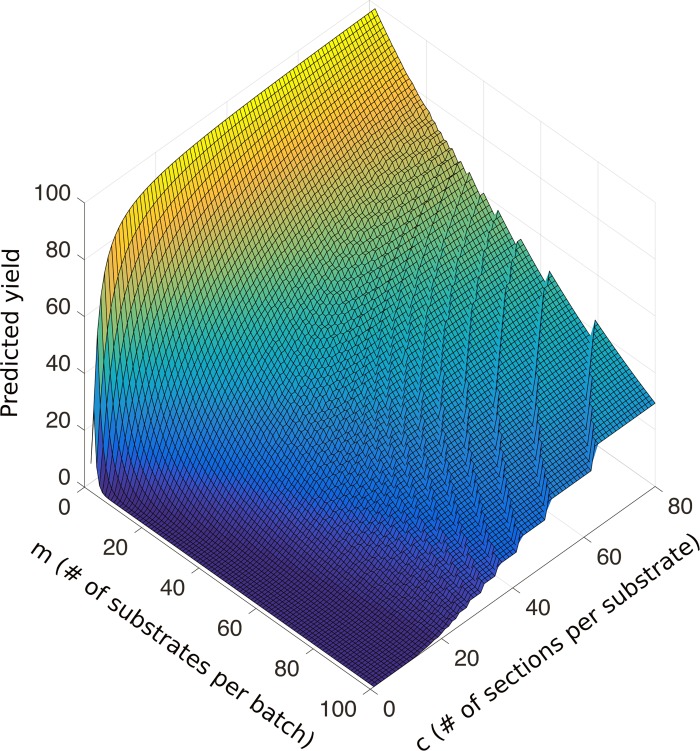
Fig 4. Predicted experiment yield for a batch process as a function of m, the number of substrates per batch (1 < m < 100) and c, the number of sections per substrate (0 < c < 80).
The upper bounds for c and m represent practical physical limits while the lower bounds represent minimum physical limits, i.e., for a batch process we mandate at least two substrates per batch with at least one section per substrate.

