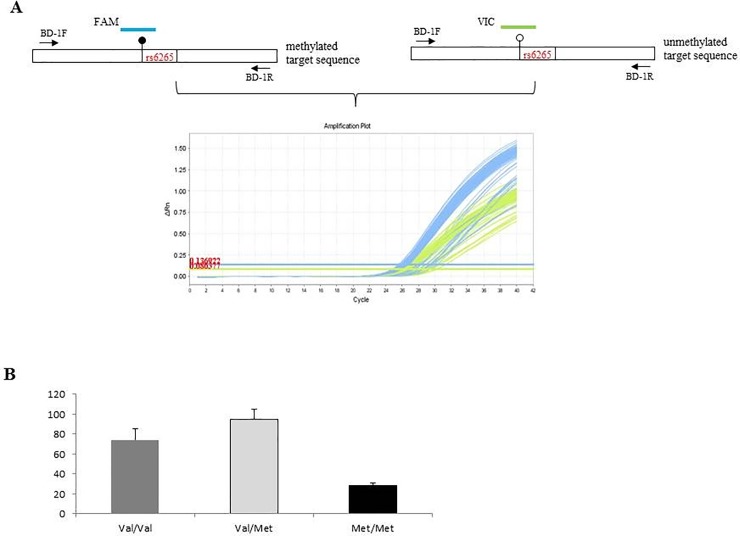
Fig 1. BDNF Methylation level determination and results.
A) Up-panel, scheme of human BDNF exonic region that containing rs6265 SNP. The box indicates the coding region, black dot is CpG site with methylation presence and white dot CpG site devoid of methylation. The arrows indicates primers (BD-1F and BD-1R) used in this assay; lower panel, amplification plot representative of the amount of fluorescence dyes FAM (blue) and VIC (green) released during PCR that is directly proportional to the amount of PCR product generated from the methylated or unmethylated allele. B) Average percentage of methylation in MS patients carrying the Val/Val (gray column), Val/Met (light gray column) and Met/Met (black column).

