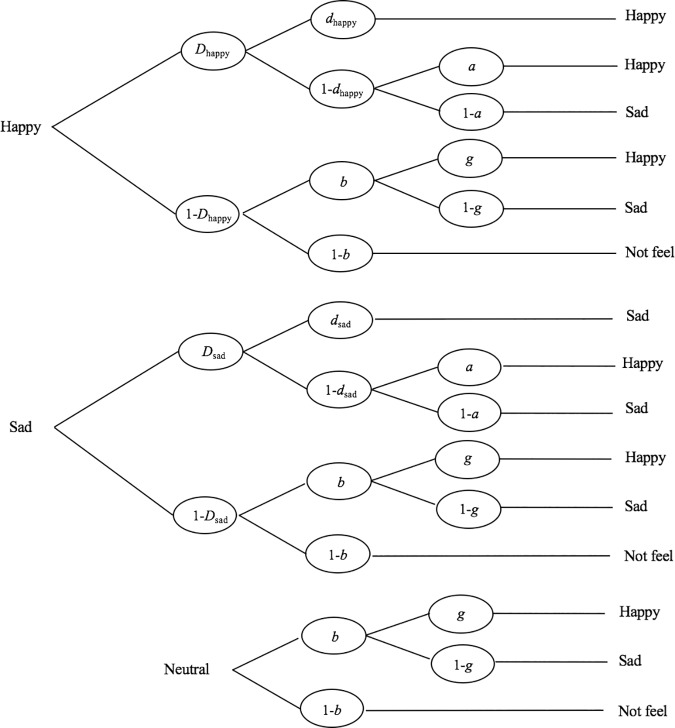
Fig 3. Model tree for multinomial processing tree modeling analysis.
The multinomial processing tree model shows multiple cognitive pathways underlying participants’ responses to happy, sad, and neutral stimuli. D is the probability that participants clearly perceive and detect an emotional signal; d is the probability of identifying the emotional category; a is the probability that participants guess the emotional category when they cannot identify the emotional category (1-d); b is the probability of guessing the presence of an emotional signal when participants cannot detect an emotional signal (1-D); g is the probability of guessing the emotional category after guessing emotional signals with b.

