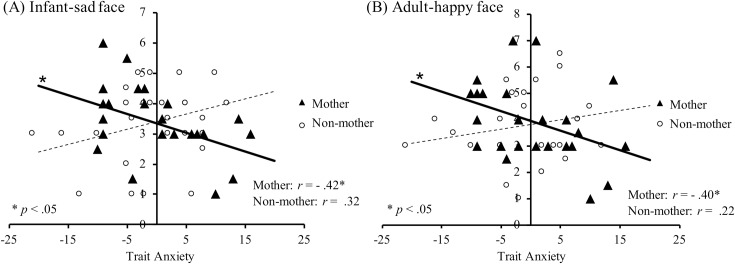
Fig 5. Relational differences between perceptual sensitivity and anxiety in mothers and non-mothers.
Scatter plots and regression lines showing the relationship between trait anxiety scores and (A) detection thresholds for infant-sad faces (r = -0.42, p < .05); (B) detection thresholds for adult-happy faces (r = -0.40, p < .05). The horizontal axis indicates trait anxiety scores centering at the grand mean. The vertical axis indicates the detection thresholds; black triangles indicate the mothers’ group (n = 25), and white circles indicate the non-mothers’ group (n = 28).

