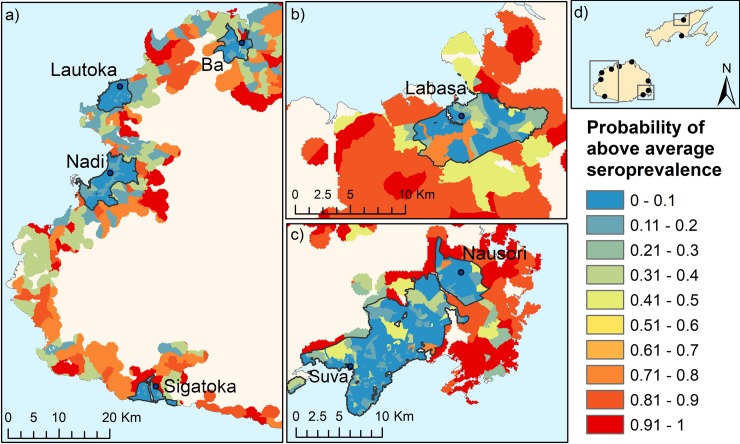
Fig 5.
Predictions of probability of above average seroprevalence generated from the BN for selected regions of Fiji: a) Western Division, b) Northern Division, c) Central Division, d) map of Fiji showing approximate locations of the predictive risk maps. Urban and peri urban areas are outlined in black.

