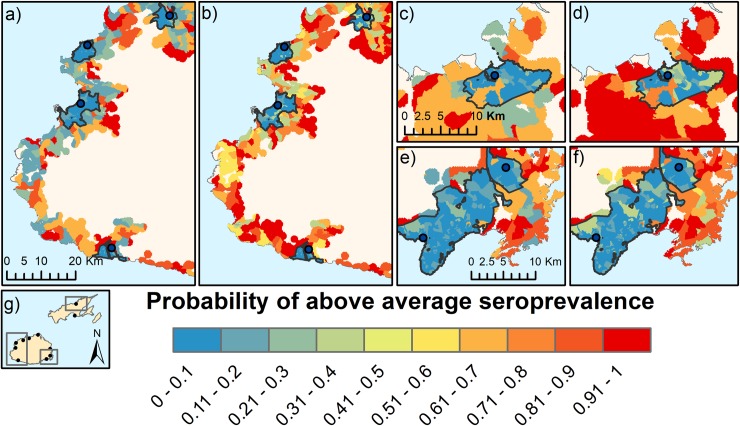
Fig 8.
Predictions of probability of above average seroprevalence generated from the BN under different scenarios of poverty rates: a) Western Division, low poverty, b) Western Division, high poverty, c) Northern Division, low poverty d) Northern Division, high poverty e) Central Division low poverty, f) Central Division high poverty, g) map of Fiji showing approximate locations of the predictive risk maps. Urban and peri-urban areas are outlined in black.

