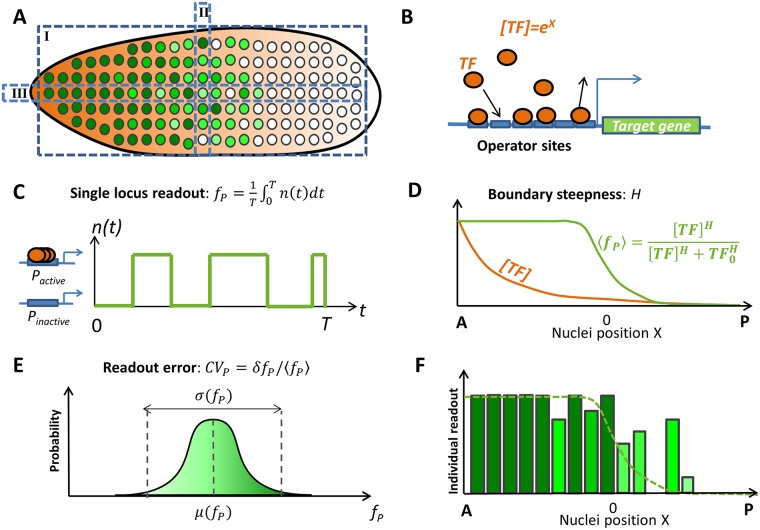
Fig 1. Setup of the problem: Features of the hb transcription pattern in early fly development.
(A) A cartoon of the side section of the fly embryo in nuclear cycles (nc) 11-13. Nuclei at different positions along the anterior posterior (AP) axis express different concentrations of hb mRNA, represented by different shades of green (dark green denotes larger concentrations). The hb gene expression pattern can be studied from different perspectives: (I) Side view of the whole embryo. (II) Single columns of nuclei at similar position along the AP axis. (III) Single rows of nuclei along the AP axis. (B) The expression of hb mRNA from the hb gene is regulated by Bcd transcription factor (TF) binding. We consider a model of gene expression regulation via the binding and unbinding of Bcd proteins (orange) to multiple operator sites (blue) of the promoter. Bcd forms an exponentially decaying gradient along the AP axes and the concentration of Bcd TF in the nuclei depends on the position of the nucleus along the AP axis, X. (C) During each nuclear cycle each hb loci switches from periods of activation to inactivation by binding and unbinding Bcd TF. The distribution of these periods depends on the binding and unbinding rates of Bcd TF. Within the model, each hb loci produces a readout fP defined as the average promoter activity level n(t) during the steady state expression interval T of the interphase of a given nuclear cycle. (D) By observing the whole embryo (perspective I in Fig. 1 A), we are able to calculate the average of the expression pattern fP of the nuclei, 〈fP〉, as a function of the nuclei’s position along the AP axes (green line), from which the boundary steepness (denoted by H) is quantified by fitting a Hill function of Bcd concentration [TF] (orange line). TF0 denotes the concentration of Bcd TF at half-maximal expression. (E) By observing nuclei at similar position X along the AP axis (perspective II in Fig. 1 A), we can make a distribution of the readout, fP and use it to calculate the readout errors CVP in the single locus readout fP. CVP is defined as the standard variation of the readout fP divided by its mean. (F) The detailed expression pattern fP obtained by observing a single row of nuclei (perspective III in Fig. 1 A) along the AP axis, depends both on the averaged pattern and the errors in the readout of this mean value.

