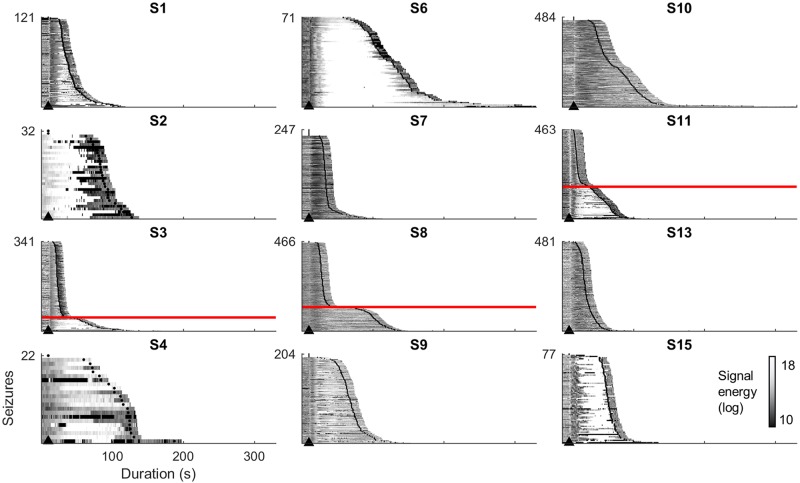
Fig 2. Seizure energy.
Average signal energy during evolution of seizures, sorted by duration, from 10s before seizure onset (marked by arrowhead) to 10s after seizure termination (according to clinicians’ marking). Red lines mark the divisions between long and short populations of seizures within bimodal subjects. Energy for individual electrode channels is provided in the supplementary material.

