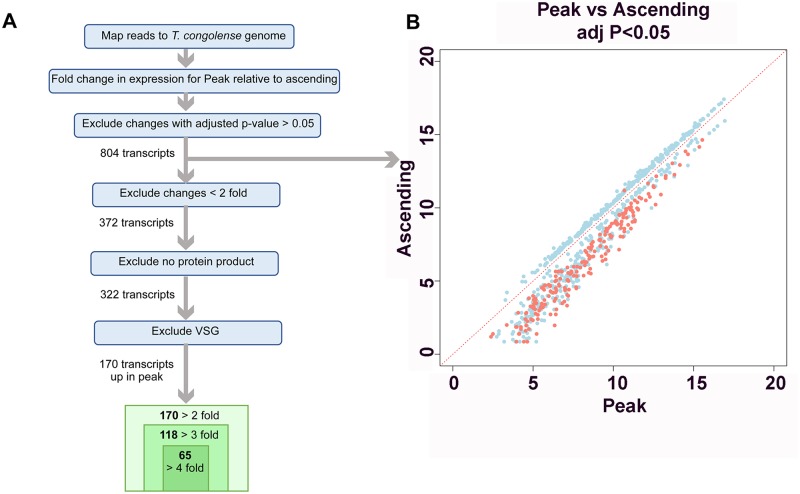
Fig 2. Expression differences between ascending and peak parasitaemia T. congolense.
(A.) Strategy for the comparison of mRNA expression between ascending and peak parasitaemia T. congolense. (B.)Scatterplot depicting transcripts that show significant (adjusted p value <0.05) expression difference between ascending and peak parasitaemia. Transcripts annotated as VSG are coloured red, these being significantly upregulated in the peak parasitaemia samples.

