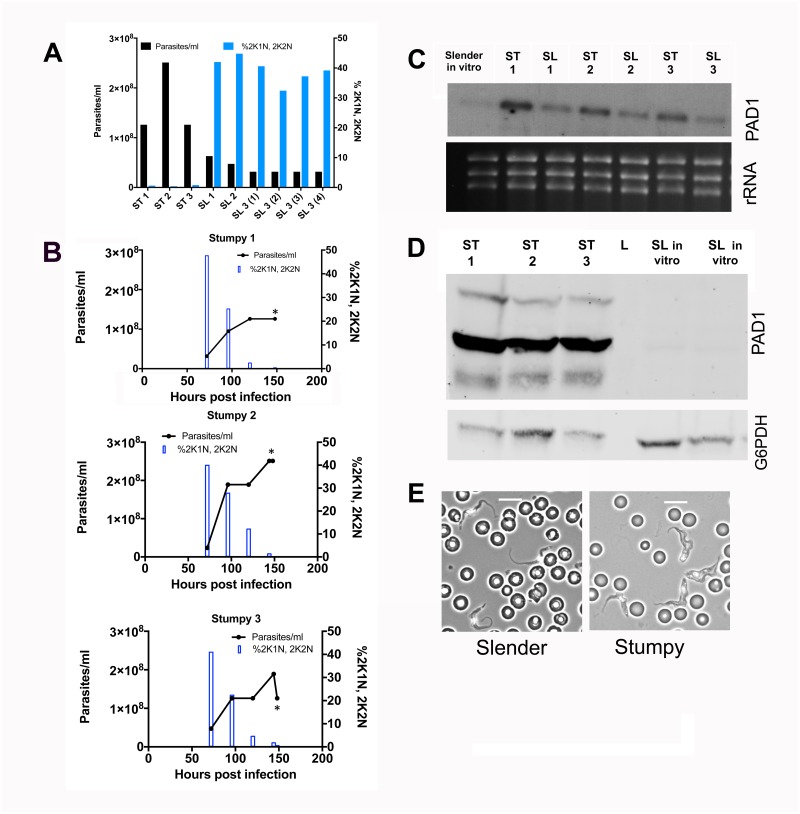
Fig 5. Biological characterisation of T. brucei material for expression analysis.
(A.) Parasitaemia (black bars) and proliferation status (blue bars) for each sample used for transcriptome analysis of T. brucei slender and stumpy forms. The proportion of parasites presenting 2 kinetoplast, 1 nucleus (2K1N), or 2 kinetoplast 2 nuclei (2K2N) configurations was assessed in 500 cells at each time point, providing a measure of proliferating cells in the population. (B.) The progression of the parasitaemia and proliferation status throughout the parasitaemia of each of the infections used to prepare stumpy form mRNA, highlighting the cell cycle arrest of parasites as they develop toward stumpy forms. Samples were harvested for RNA on day 6 (indicated by an asterisk) (C.) Northern blot of each mRNA sample used for transcriptome analysis hybridised to a riboprobe for the stumpy specific marker, PAD1. Stumpy samples express more PAD1 mRNA than slender samples. (D.) PAD1 protein expression for the stumpy samples used for transcriptome analysis. In vitro cultured slender samples provide a negative control. Loading is indicated by detection of G6PDH (E.) Morphological analysis of the slender form samples (left hand side) or stumpy forms (right hand side) in blood. Scale bar represents 10μm.

