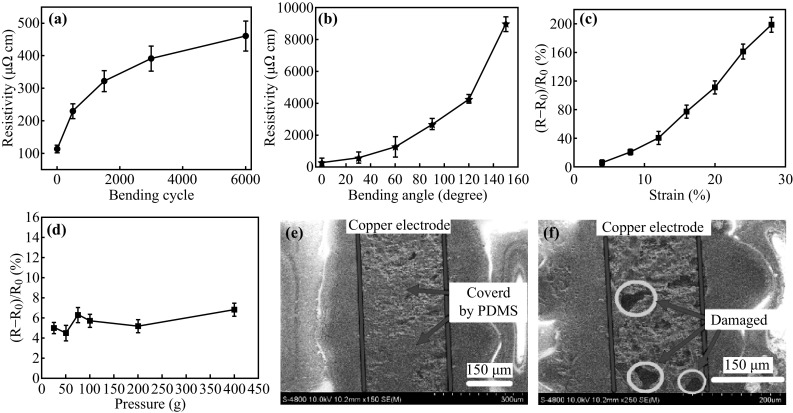
Fig. 5.

a Resistivity as a function of the repeated bending/relaxation cycles. b Resistive response of the sensor to the bending angle from 0° to 150°. c Resistive response of the sensor to the strain. d Response of the sensor to the pressure from 5 to 400 g. e SEM images of sandwich structure. The red lines describe the copper electrode area, and the blue arrows show where the electrode is covered by PDMS. f Typical SEM image of copper electrode after 6000 bending cycles. The blue circles show the damaged parts of copper electrode. (Color figure online)
