Fig. 1.

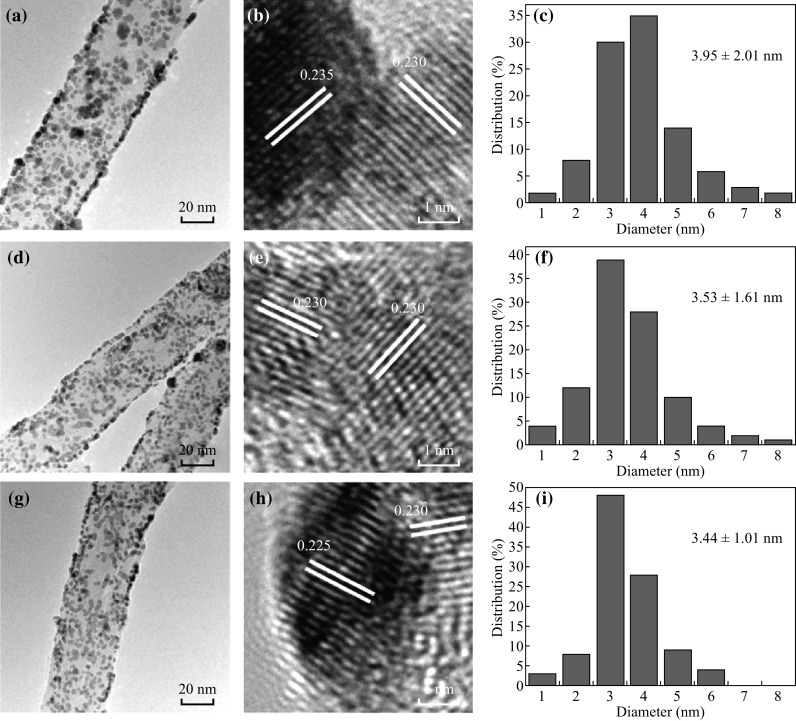
TEM and HRTEM images of CNTs-PdAu/Pt trimetallic NPs and their size distribution with different Pd/Au/Pt ratios: a, b, c 1:3:2, d, e, f 2:2:2, and g, h, i 3:1:2

TEM and HRTEM images of CNTs-PdAu/Pt trimetallic NPs and their size distribution with different Pd/Au/Pt ratios: a, b, c 1:3:2, d, e, f 2:2:2, and g, h, i 3:1:2