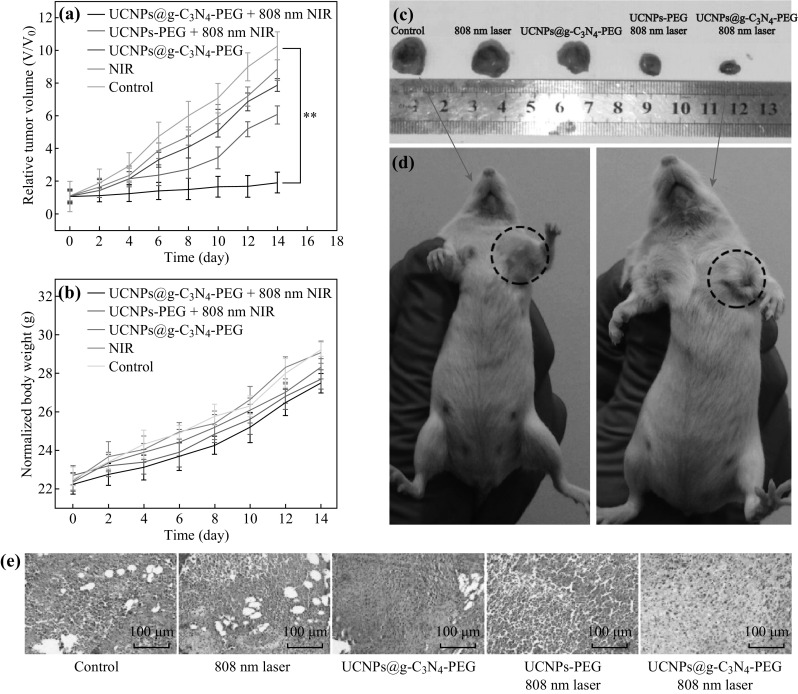
Fig. 9.

a In vivo tumor volume growth curves of mice in different groups after various treatments. b Body weight changes of Balb/c mice versus treated time under different conditions. c Photographs of excised tumors from representative Balb/c mice after 14 day treatment and d the corresponding digital photographs of mice in the control group and “UCNPs@g-C3N4 − PEG with 808 nm laser” group after 14 day treatment. e H&E stained tumor sections after 14 day treatment from different groups. Reproduced with permission from Ref. [118] Copyright 2016 American Chemical Society
