Fig. 3.
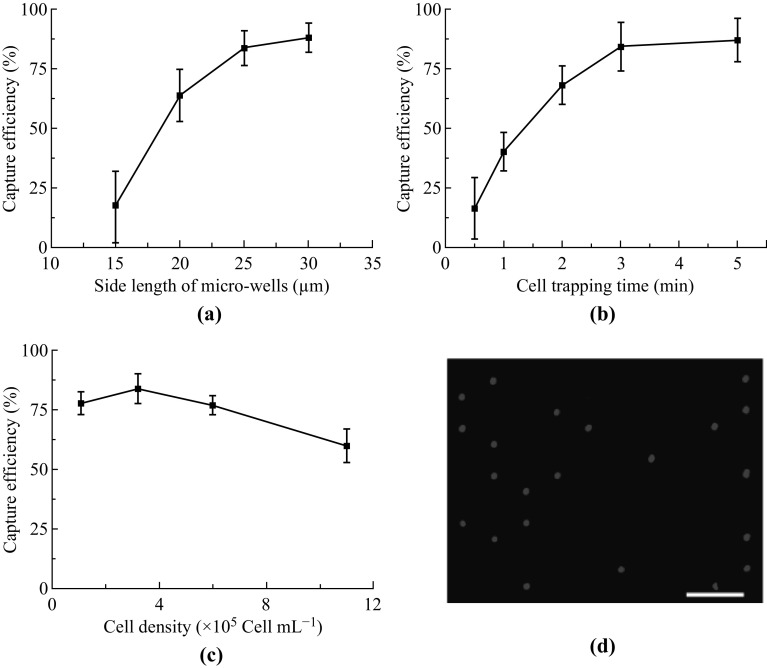
The optimization of cell capture efficiency. The cell capture efficiency was defined as the ratio between captured cells and all cells pumped into the microfluidic chip. a The relationship between cell capture efficiency and side length of square microwells. Other operation parameters are: 3.2 × 10⁵ Cells mL−1 and 3 min trapping time. b The relationship between cell capture efficiency and cell trapping time. Other operation parameters are: 25 µm in side lengths, and 3.2 × 10⁵ Cells mL−1. c The relationship between cell capture efficiency and cell density. Other operation parameters are: 25 µm side lengths and 3 min trapping time. In a, b and c, data are expressed as the mean ± SD from 3 independent assays. d Trapped single cells were stained by DAPI, which are blue spots. Scale bar: 100 µm

