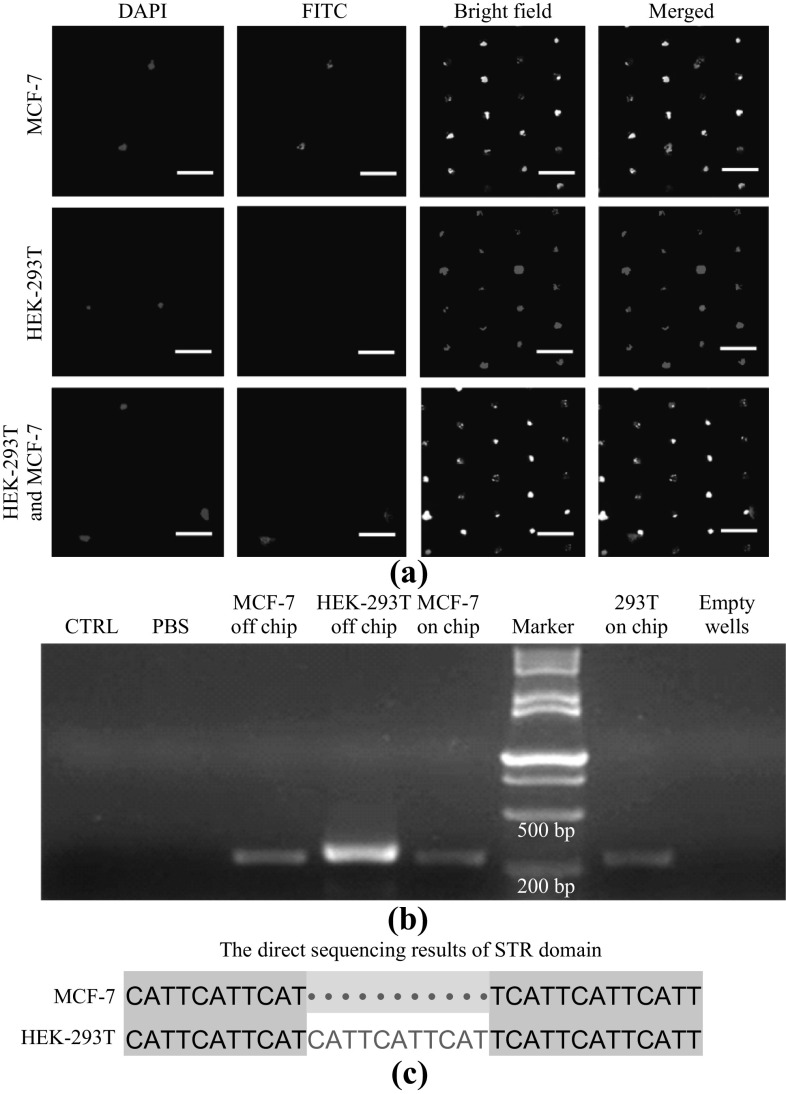
Fig. 4.
Fluorescently identifying, amplifying and sequencing MCF-7 cells. a The fluorescent images of cells in microwells. Upper row is an area contains only MCF-7 cells which exhibit both DAPI (blue) and FITC (green) staining; Middle row contains only HEK-293T cells which exhibit only DAPI (blue) staining; Lower row contains both HEK-293T cells and MCF-7 cells. Scale bar: 50 µm. b DNA amplification products of STR domain were verified by fluorescence image of agarose gel. Left two columns are the empty run and PBS reaction, both as negative control; The third and fourth left columns are the products from pure HEK-293T and MCF-7 cells, without the chip processing, both as positive control. Three right columns are products from chip areas contain no cells, only HEK-293T cells and only MCF-7 cells, sequentially. c The sequencing results for STR domain from the cells lysates from areas, respectively, contain only HEK-293T and MCF-7 cells. (Color figure online)

