Fig. 5.
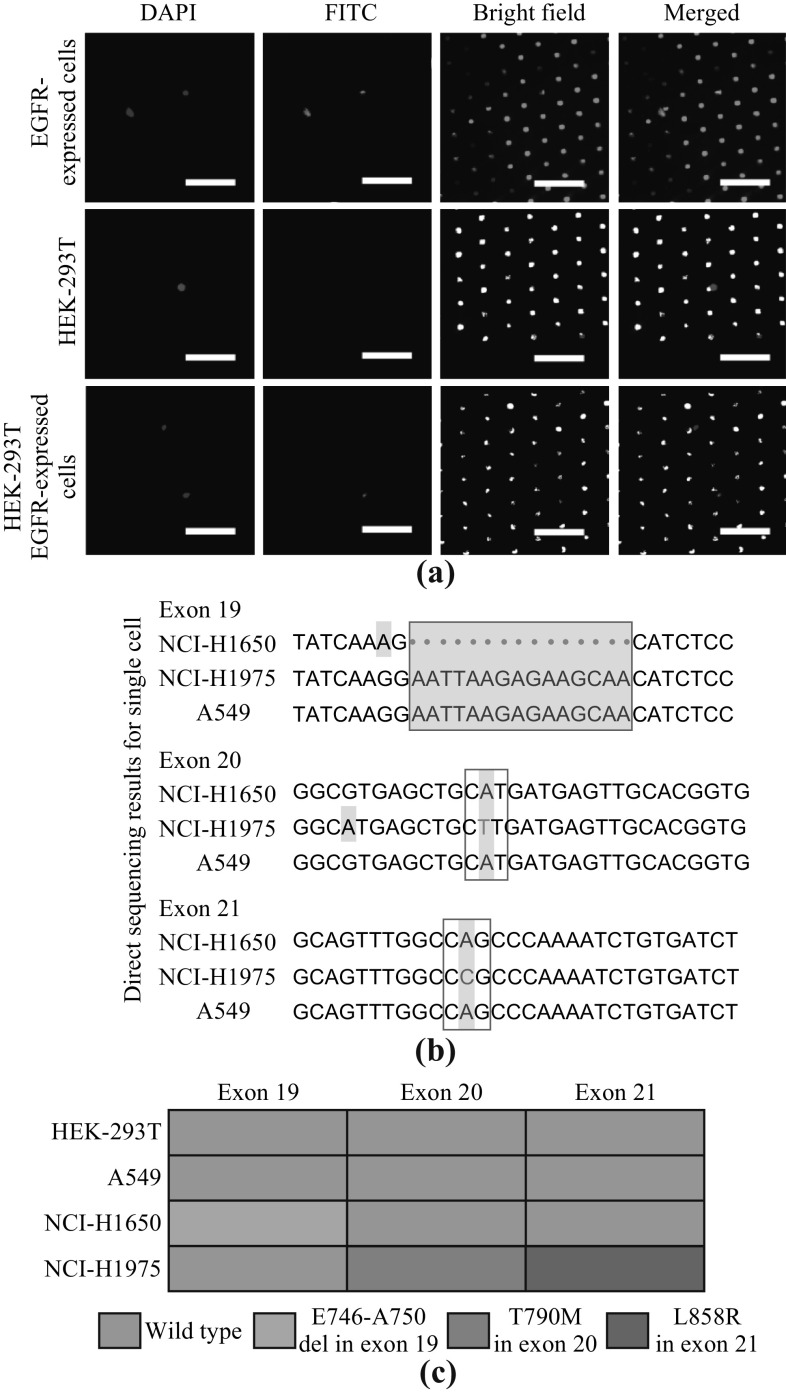
Detecting EGFR multi-mutations. a The fluorescent images of cells in microwells. Upper row is an area contains only EGFR-expressed cells which exhibit both DAPI (blue) and FITC (green) staining; middle row contains only HEK-293T cells which exhibit only DAPI (blue) staining; lower row contains both HEK-293T cells and EGFR-expressed cells. Scale bar: 100 µm. b The Sanger’s sequencing provides accurate mutation information: In exon 19, NCI-H1650 cells show a deletion mutation (Del E746-A750); in exon 20, NCI-H1975 cells show a point mutation (T790M); in exon 21, NCI-H1975 cells show a point mutation (L858R). c For NCI-H1975 cells, mutations in both exon 20 and 21 are detected; for NCI-H1650 cells, mutation in exon 19 is also detected. In addition, no false-positive result on either HEK-293T or A549 cells is detected. (Color figure online)

