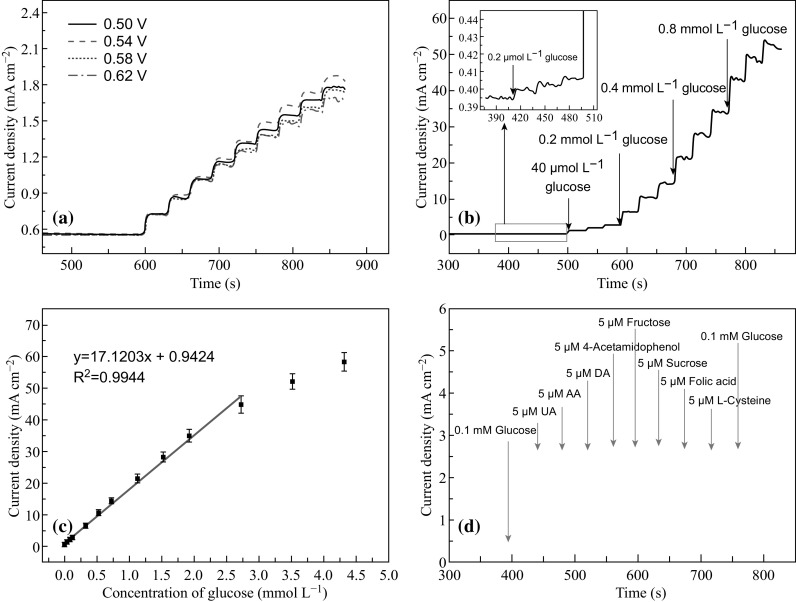
Fig. 6.

a Effects of various potentials on the amperometric response of CuNi/C electrodes given the successive addition of 8 μM glucose. b Amperometric responses of CuNi/C electrodes given the successive addition of glucose at 0.54 V. The left inset shows partial amplification of the amperometric response to low glucose concentration. c The corresponding calibration curve of the response current density relative to glucose concentration. d Interference test performed on CuNi/C electrodes by adding 0.1 mM glucose, 5 μM DA, 5 μM AA 52 μM UA, 5 μM acetaminophen, 5 μM fructose, 5 μM sucrose, 5 μM folic acid, and 5 μM l-cysteine into 0.1 M NaOH at 0.54 V
