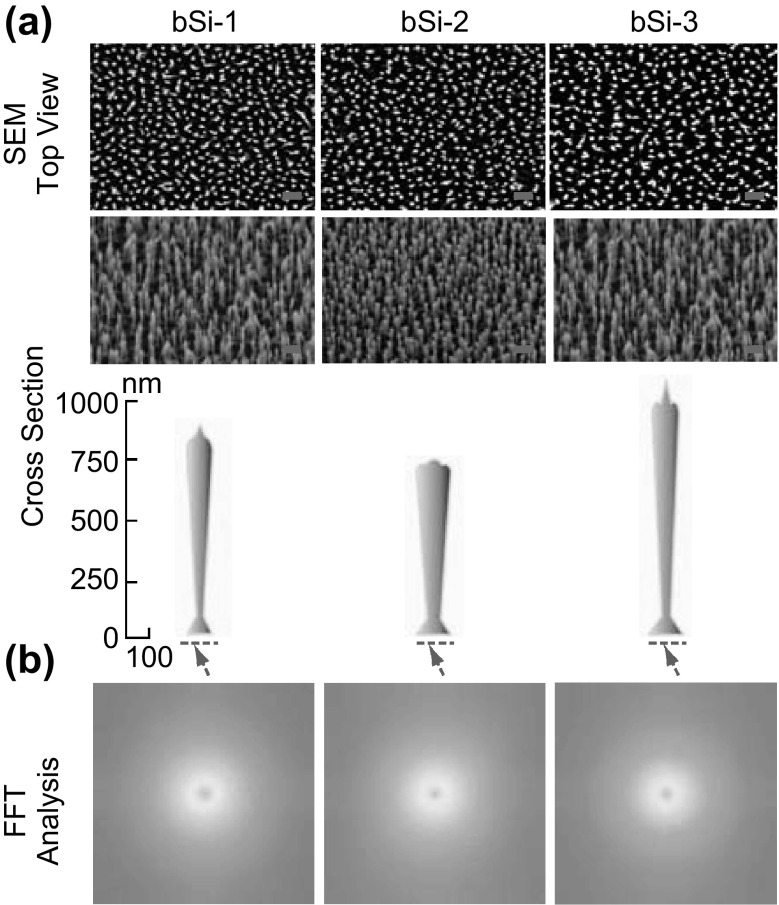
Fig. 2.
Comparative analysis of the bSi surface nanoarchitecture. a The upper plane of the surfaces on the SEM images, ×20,000 magnifications, and scale bar is 1 µm. The distinct morphologies of the nanopillars present on each type of bSi surface as seen from the SEM micrographs taken at a tilted angle of 45° (SEM cross sections) from the baseline, ×30,000, scale bar is 200 nm. The inset shows a schematic depiction of the representative shapes of the nanopillars present on bSi surfaces derived from side-view SEM images, highlighting the distinct pillar morphology including the pillar height and tip width. b The average fast Fourier transform of tiles of size 512 × 512 pixels for each of the species. The center pixel has been replaced by the averaged gray value

