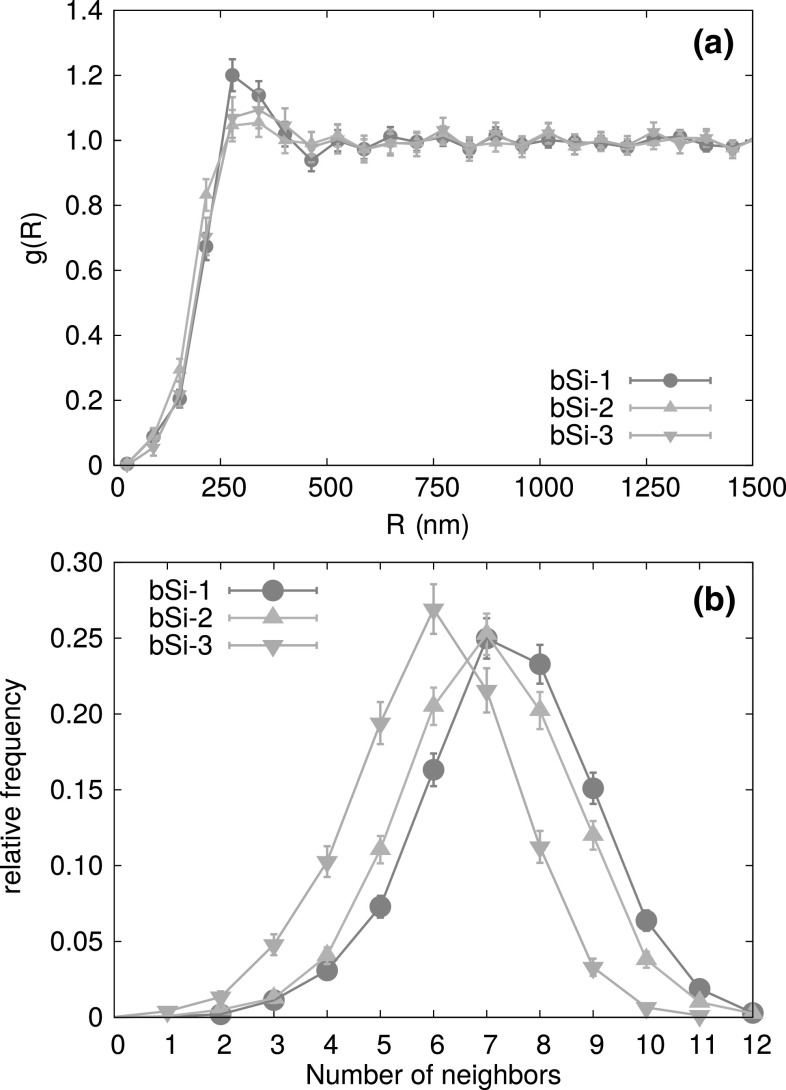
Fig. 3.
Analysis for nanopillar tip distributions. a Pair-correlation function (Eq. 1) of nanopillar tip positions as a function of distance between pillars for bSi-1, bSi-2, and bSi-3 substrate. b The distributions of numbers of neighbors found around each pillar within the first peak of the pair-correlation function with a distance less than 500 nm

