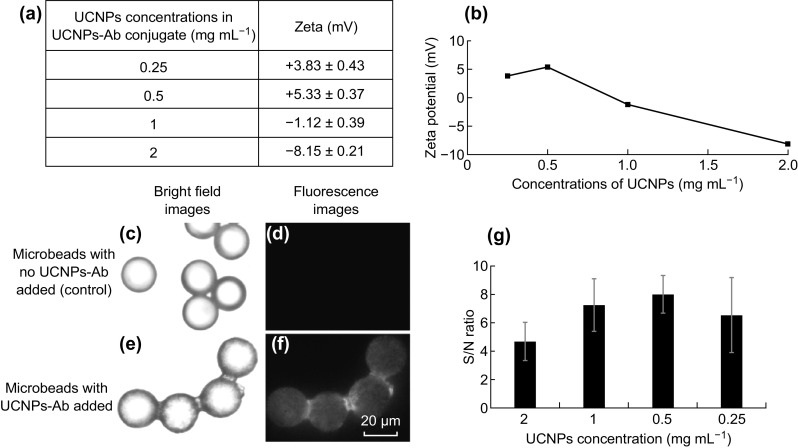
Fig. 6.

a Different surface charge of UCNPs-Ab conjugates at different concentrations of UCNPs, and b corresponding graph for surface charge versus UCNPs concentrations in UCNPs-Ab conjugate. c, e Bright field and d, f corresponding fluorescent microscopy images at 40× magnification of NaYF4:YbTm microbeads with and without UCNPs-Ab, and g corresponding S/N ratios of UCNPs-Ab at different concentrations of UCNPs used in the conjugation reaction (data represent mean ± SD; n = 20 microbeads)
