Fig. 7.

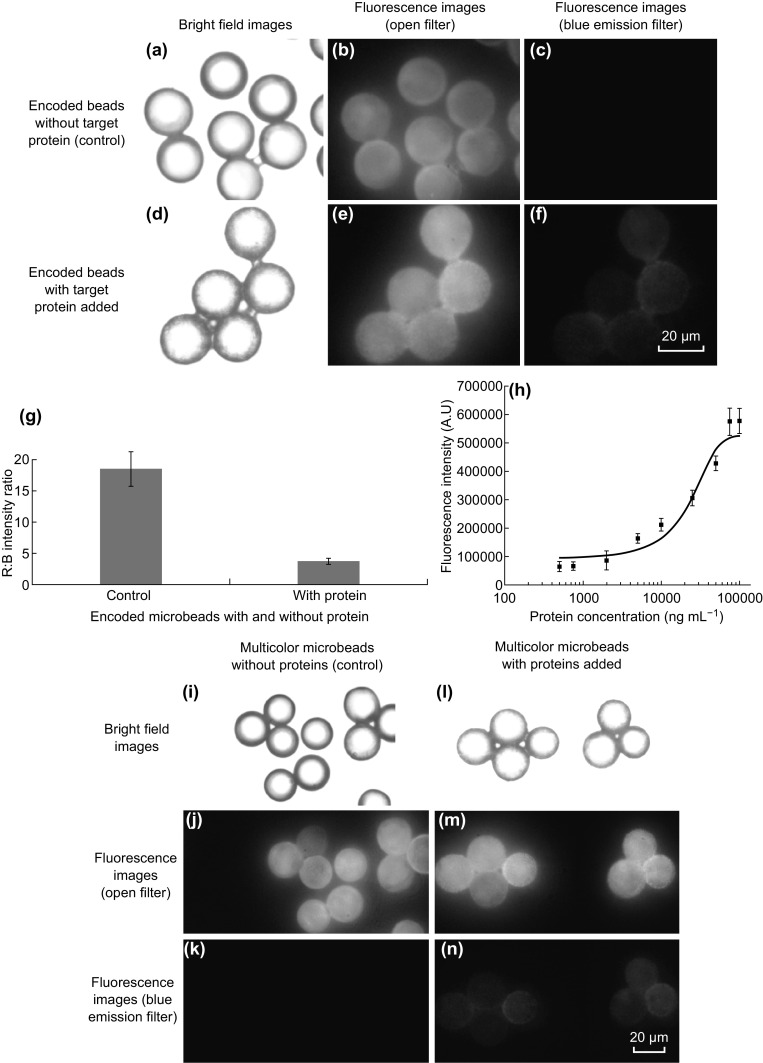
Bright field images and corresponding fluorescent microscopy images of open filter and filter for collecting blue emissions (at 40× magnification). a, b, c without (control) and d, e, f with target HSA protein added. g Plot of R/B intensity ratio for encoded microbeads with and without protein target added for detection (data represent mean ± SD; n = 20 microbeads). h Calibration curve for quantitative detection of target HSA protein (data represent mean ± SD; n = 20 microbeads). Multiplex detection of target proteins HSA and hCRP using NaYF4:50%Yb1%Er and NaYF4:18%Yb2%Er30%Lu UCNPs-encoded multicolor microbeads. Bright field images and corresponding fluorescent images of open filter and filter for collecting blue emissions for encoded microbead-based detection for i, j, k without (control) and l, m, n with target proteins added
