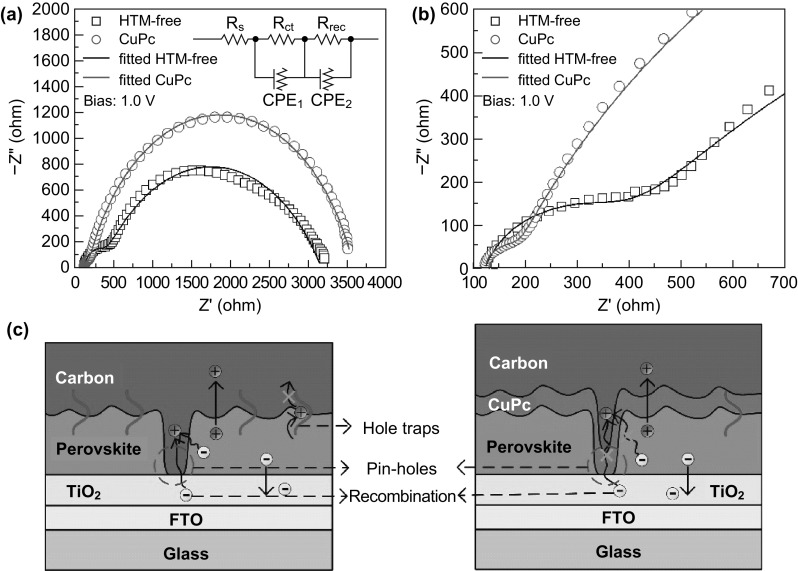
Fig. 5.

a Nyquist plots at bias 1.0 V of the HTM-free and CuPc-based CsPbBr3 PSCs in the dark. Inset: the equivalent circuit employed to fit the Nyquist plots. b Nyquist plots in the high frequency range. c Illustration depicting the function of CuPc as HTM layer in PSCs
