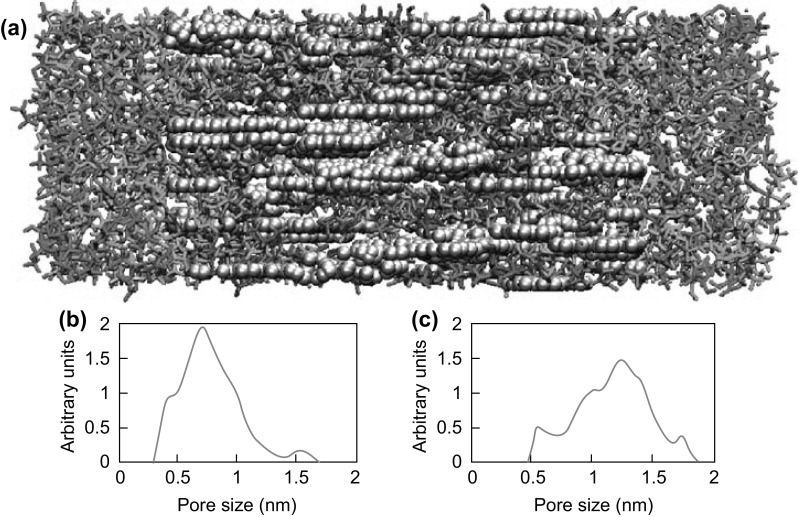
Fig. 1.

a CSAC model and the pore size distributions for average pore size of b 0.75 nm and c 1.23 nm (gray: carbon atoms, red: cations and green: anions).
Reprinted with permission from Ref. [61]. Copyright (2014) American Chemical Society. (Color figure online)
