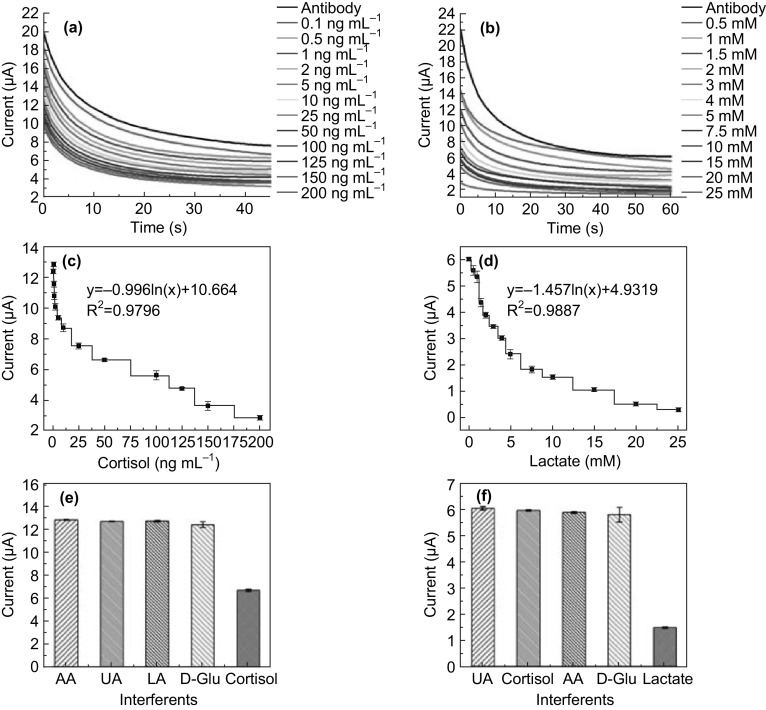
Fig. 6.
Chronoamperometric curve recorded from Ab@e-RGO SPE vs. different concentrations of a antigen cortisol, b antigen lactate. c Calibration curve from anti-cortisol Ab@e-RGO SPE against various concentrations of antigen cortisol. d Calibration curve from anti-lactate Ab@e-RGO SPE against various concentrations of antigen lactate. e, f Investigations of sensor response toward cortisol and lactate, respectively, in addition to other non-specific proteins, to assess the device’s specificity (concentration was fixed at 1 mM)

