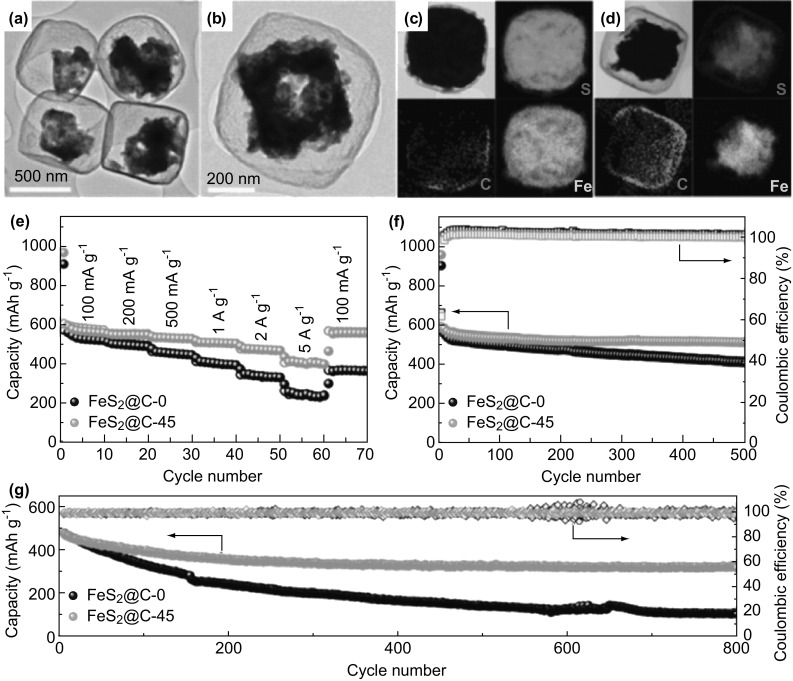
Fig. 6.

a TEM image and b HRTEM image of FeS2@C with 45-minute etching. Element mapping images of: c FeS2@C-0 and d FeS2@C-45. e Comparison of rate performance of FeS2@C-0 and FeS2@C-45 at various current densities. f Variation of capacity retention of FeS2@C-0 and FeS2@C-45 in 100 cycles performance at 100 mA g−1. g Long-term cyclic performance of FeS2@C-0 and FeS2@C-45. Reprinted with permission from Ref. [86]
