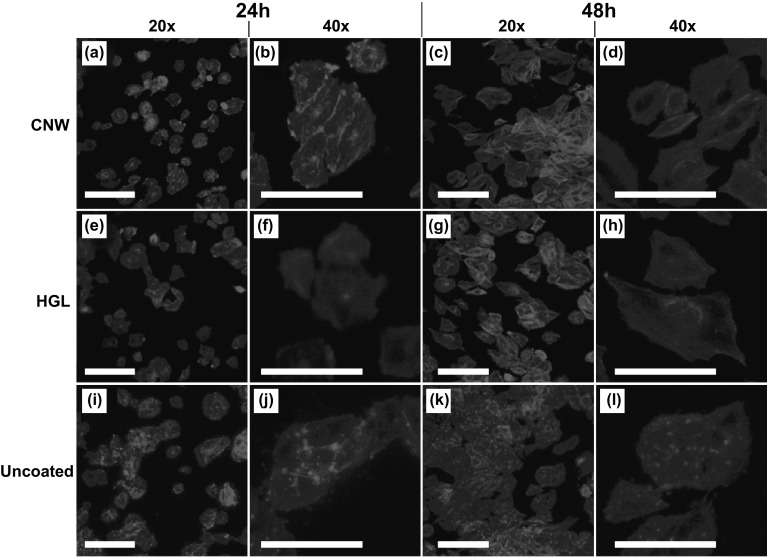
Fig. 5.
Representative fluorescent images showing the morphology of Saos-2 cells stained with phalloidin and attached to the a, b CNW surface@24 h (× 20 and × 40), c, d CNW surface@48 h (× 20 and × 40), e, f HGL@24 h (× 20 and × 40), g, h HGL@48 h (× 20 and × 40), i, j uncoated Thermanox@24 h (× 20 and × 40), and k, l uncoated Thermanox@48 h (× 20 and × 40). All scale bars are 10 µm (A color version of this figure can be viewed online)

