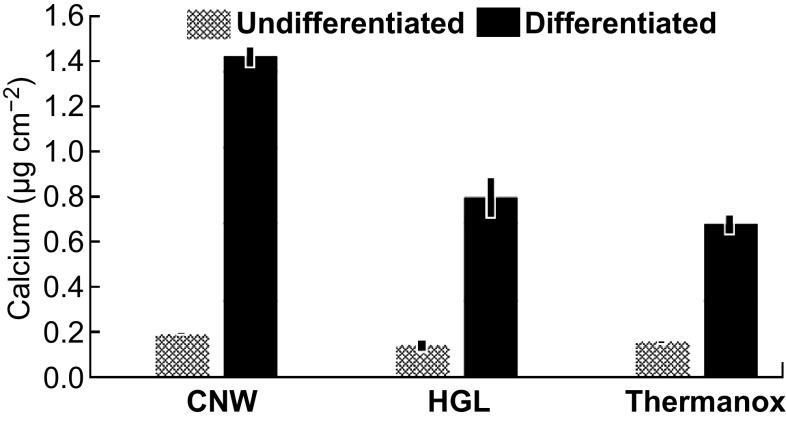
Fig. 8.
Outcomes of the differentiation/mineralization assay showing the production of calcium by cells attached to the graphene and control surfaces. Data are based on the mean (± standard deviation) of triplicate wells for each surface, corrected for cell density (as measured by MTT assay conducted in parallel with the differentiation assay)

