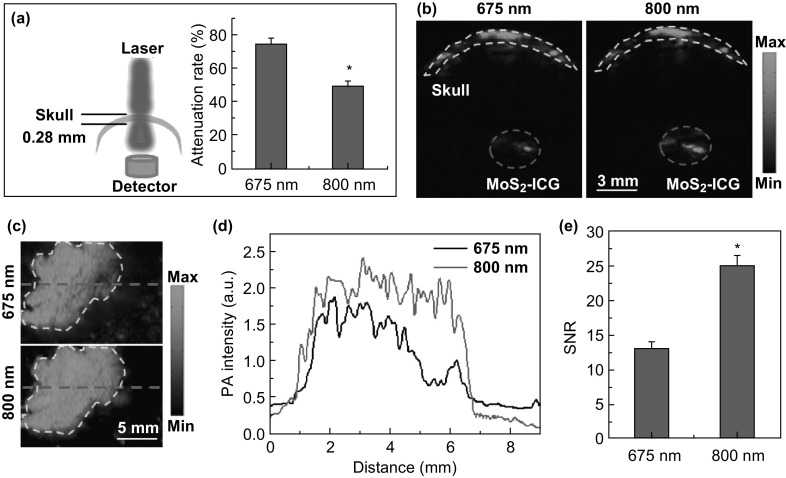
Fig. 3.
a Attenuation rate of 675- and 800-nm pulsed laser after penetrating the mouse skull. b Photoacoustic cross-sectional B-scan images of MoS2–ICG covered with mouse skull under 675- and 800-nm laser excitation. Yellow dashed line delineates the outline of the skull. Red circle indicates the MoS2–ICG sample. c Photoacoustic MAP images of mouse back post-subcutaneous injection of MoS2–ICG under 675- and 800-nm laser excitation. The enclosed area by the yellow dashed line indicates the injected region. d Photoacoustic signal intensity plot corresponding to the two red dashed lines in c. e SNR of photoacoustic images under 675- and 800-nm laser excitation in c

