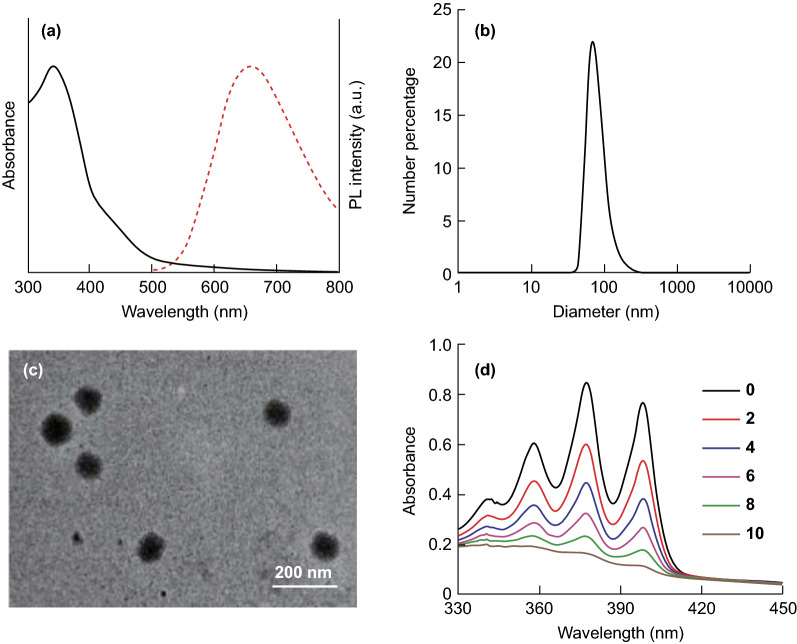
Fig. 1.
a UV–visible absorption (solid line) and photoluminescence (PL, dashed line) spectra of PPDCT-DSPE-mPEG NPs. b Number size distribution of PPDCT-DSPE-mPEG NPs. c TEM image of PPDCT-DSPE-mPEG NPs. d Absorbance decay of 64 µM ABDA in the presence of PPDCT NPs over 10 min of 0.15 W cm−2 white light

